|
|
|
|
In today’s competitive era, enterprise leaders need information about business operations as they occur. The need is real-time business intelligence (RTBI) system to minimize the latencies between business events happening and resulting decision, corrective action or notification being initiated.
As a solution to this need, Intellicus introduces a real-time monitoring capability that makes it possible for you to view your operations data in motion. It features self-service, interactive dashboards with current operational KPIs and measures for business users, including executives on the go, managers and analysts. Real-time charts provide instant visuals for in-depth analysis that enables you to quickly react to performance improvement opportunities.
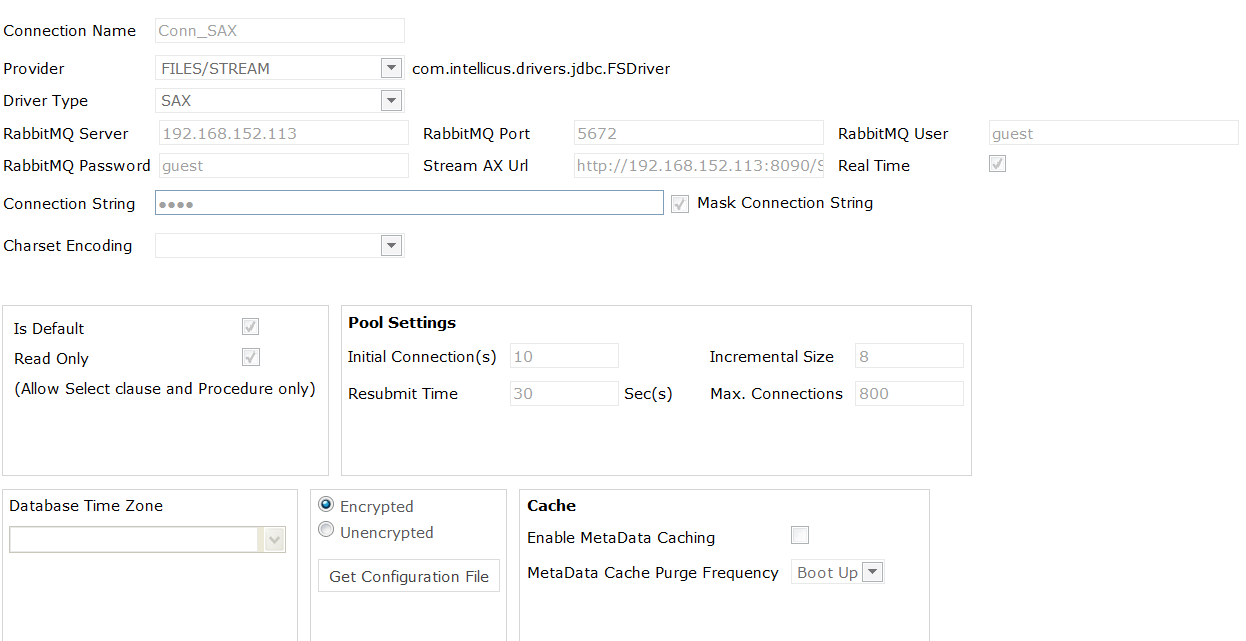
Intellicus' Message Queue type connections enable to stream real-time data. Below image shows a connection that takes StreamAnalytix "SAX"as a real-time data source:
The real-time Query Objects are based upon these Message Queue type connections.
In Ad hoc Visualizer, a real-time chart would thus be generated for the selected real-time Query Object. The real time chart could be any of Bar, Column, Curve, Line, Gauge, Area, Curve Area or Counter.
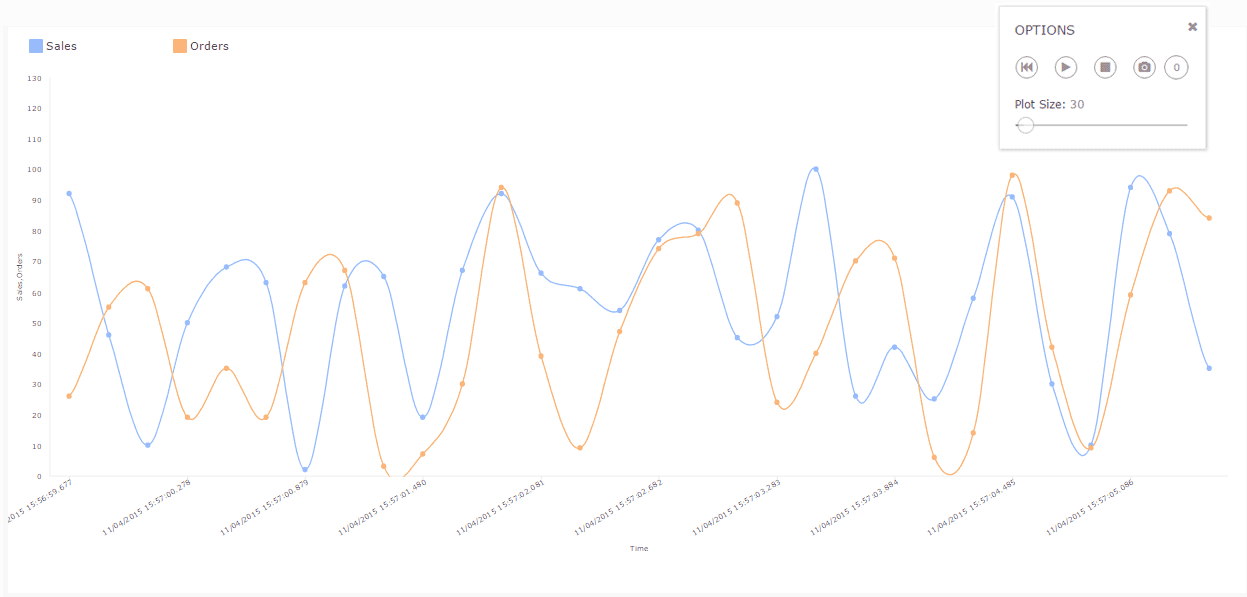
You would then view a chart with dynamically changing data values. An example where the Sales Manager is able to track real-time sales varying with time is shown below:
You can interact with real time charts for performing the following operations:
You can also capture ‘Snapshot’ of real-time chart manually at a given instance of time. Automatic snapshots get captured upon meeting a user-defined condition. Snapshot is a beta feature in this release.
You can thereafter create dashboard widgets from the real-time reports to view streaming data on your dashboard.
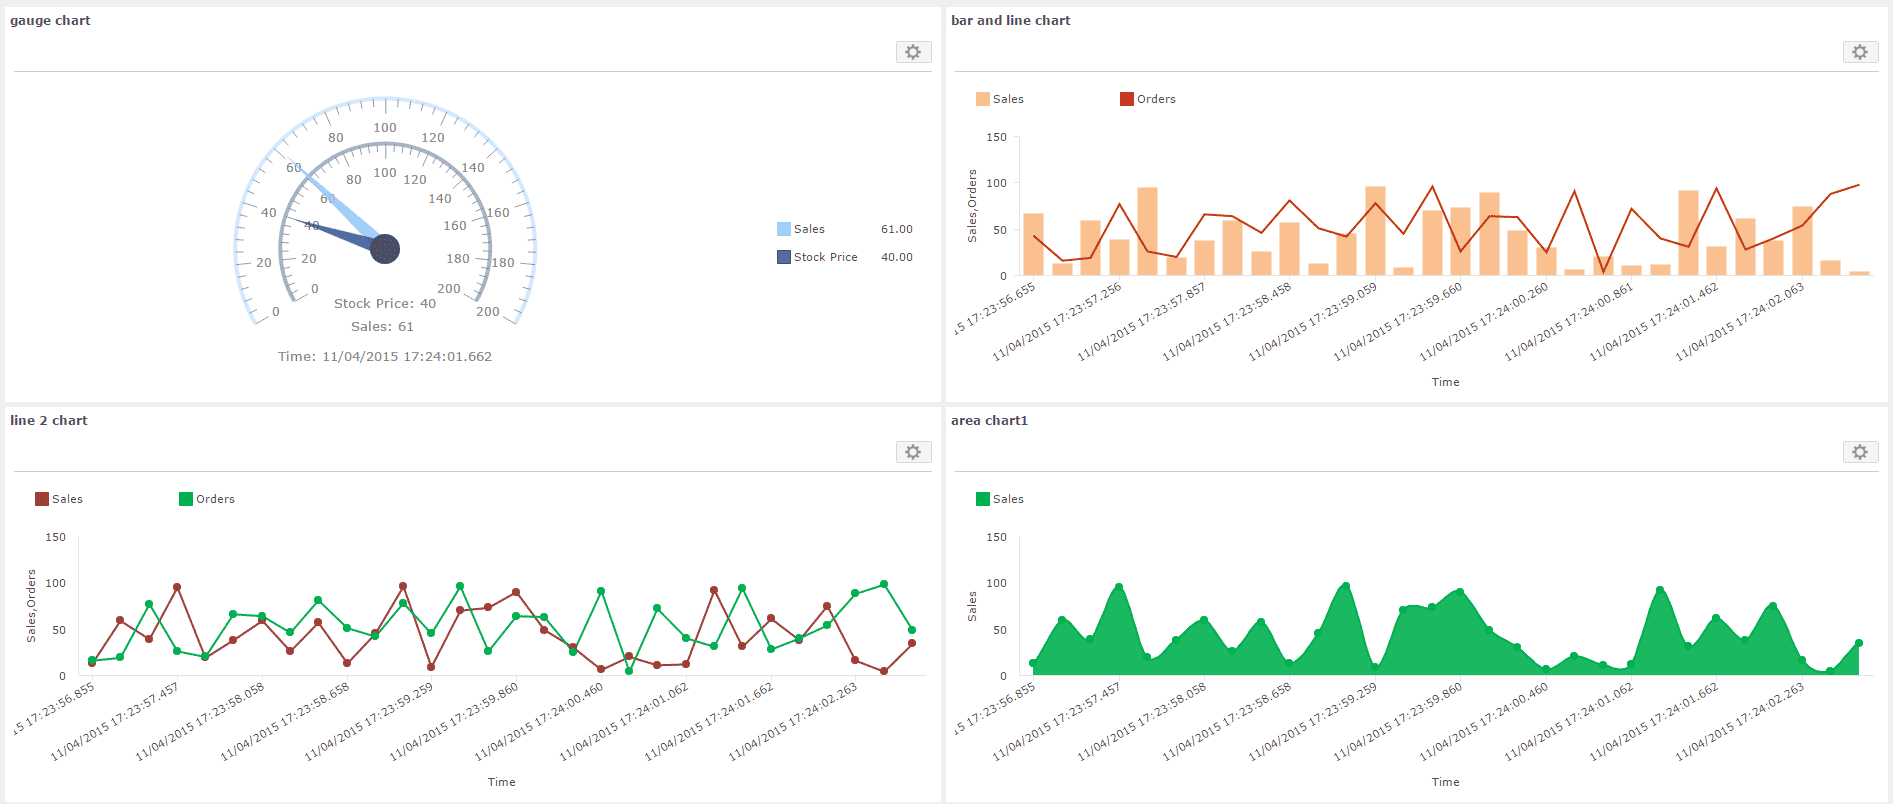
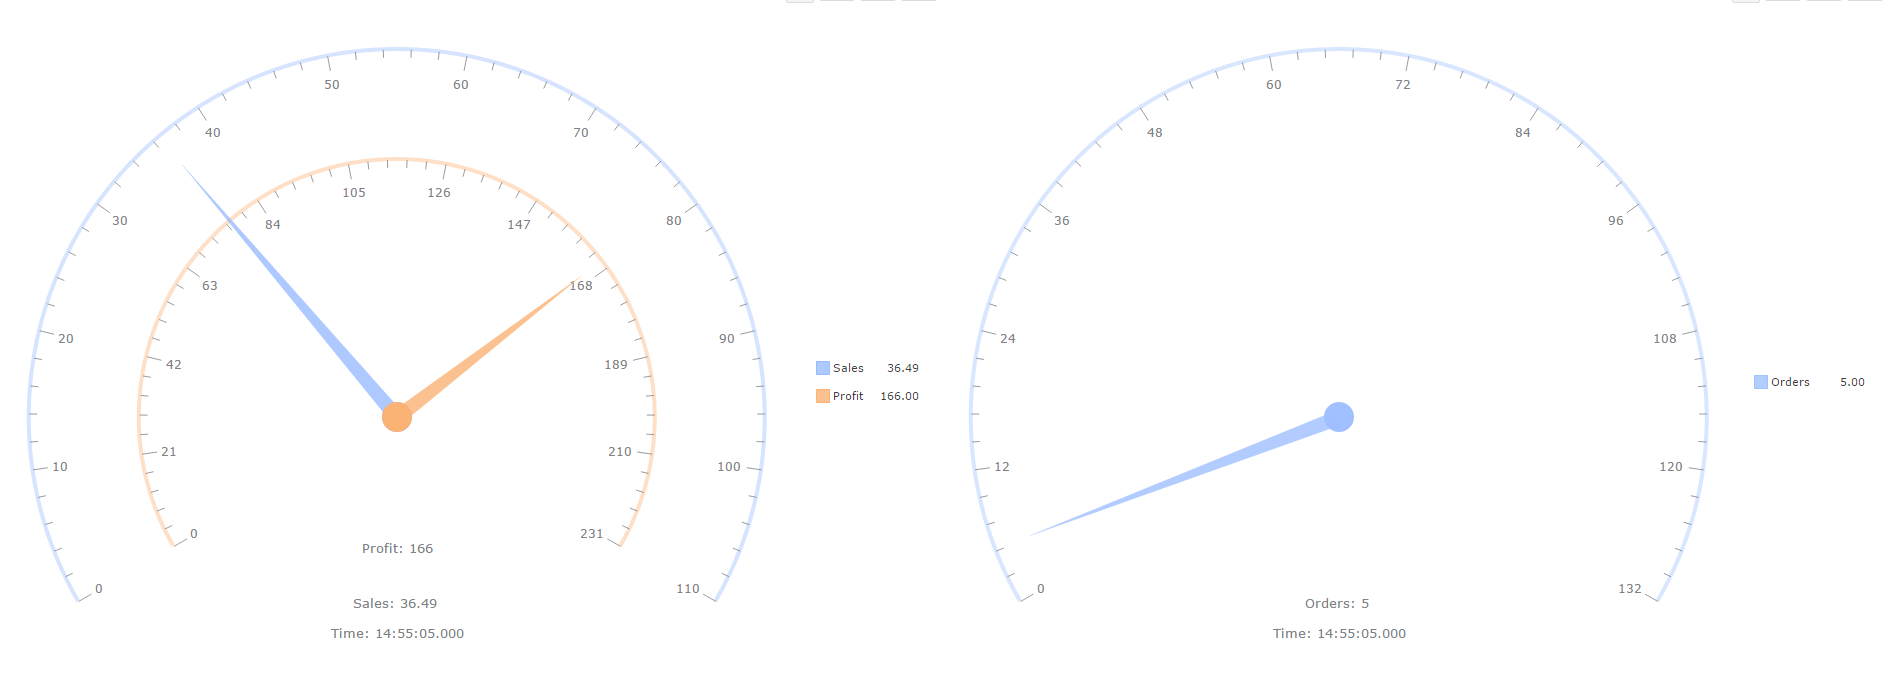
In order to get immediate business insights at a glance, Intellicus introduces gauge and counter charts. Angular Gauge or Speedometer chart visualization is very useful to show data which is shown using similar gauges in real time, like speed, volume equalizer, etc. Our Angular Gauge chart can display multiple axes, multiple arrows, also show color bands on the axis. Below is an example to show real-time sales, profit and orders over time using multiple angular gauge charts:
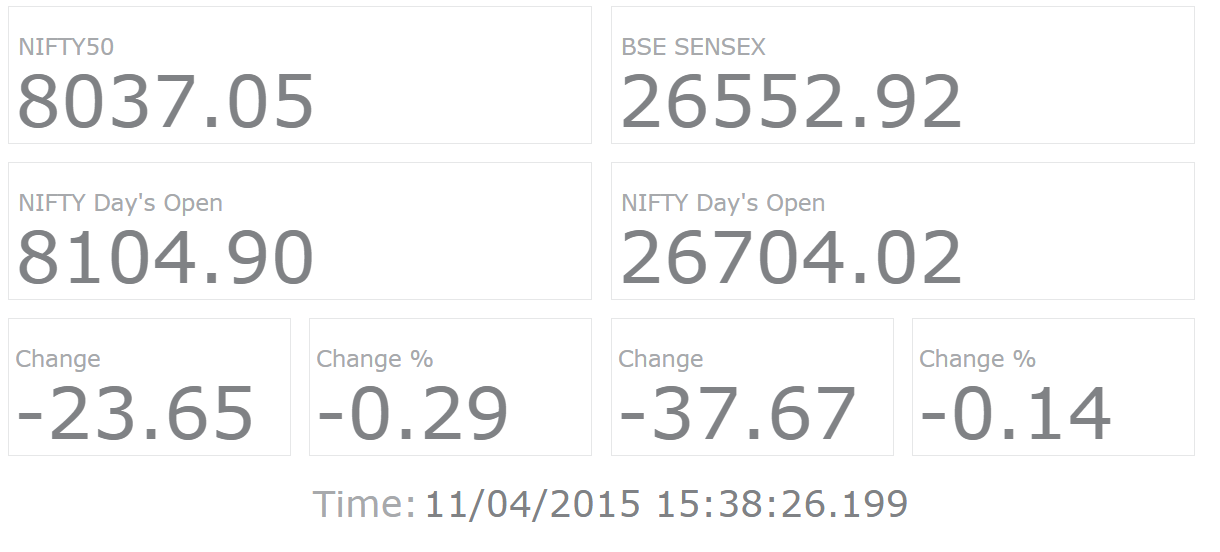
A visualization of a Number Counter chart to view live stock market updates is shown below:
These chart types work for static as well as dynamic (real-time) data.
Intellicus 7.3 supports REST calls for integrating Intellicus data and functions into an application. With REST APIs you can perform CRUD operations and apply transformations on various Reporting use cases as listed below:
Some characteristics of Intellicus REST APIs that act as key differentiators include:
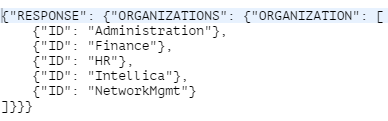
A sample request/ response for getting list of organizations in JSON format is as below:
REST Request:
GET http://<IP>:<Port>/intellicus/rest/org?responseType=JSON
REST Response:
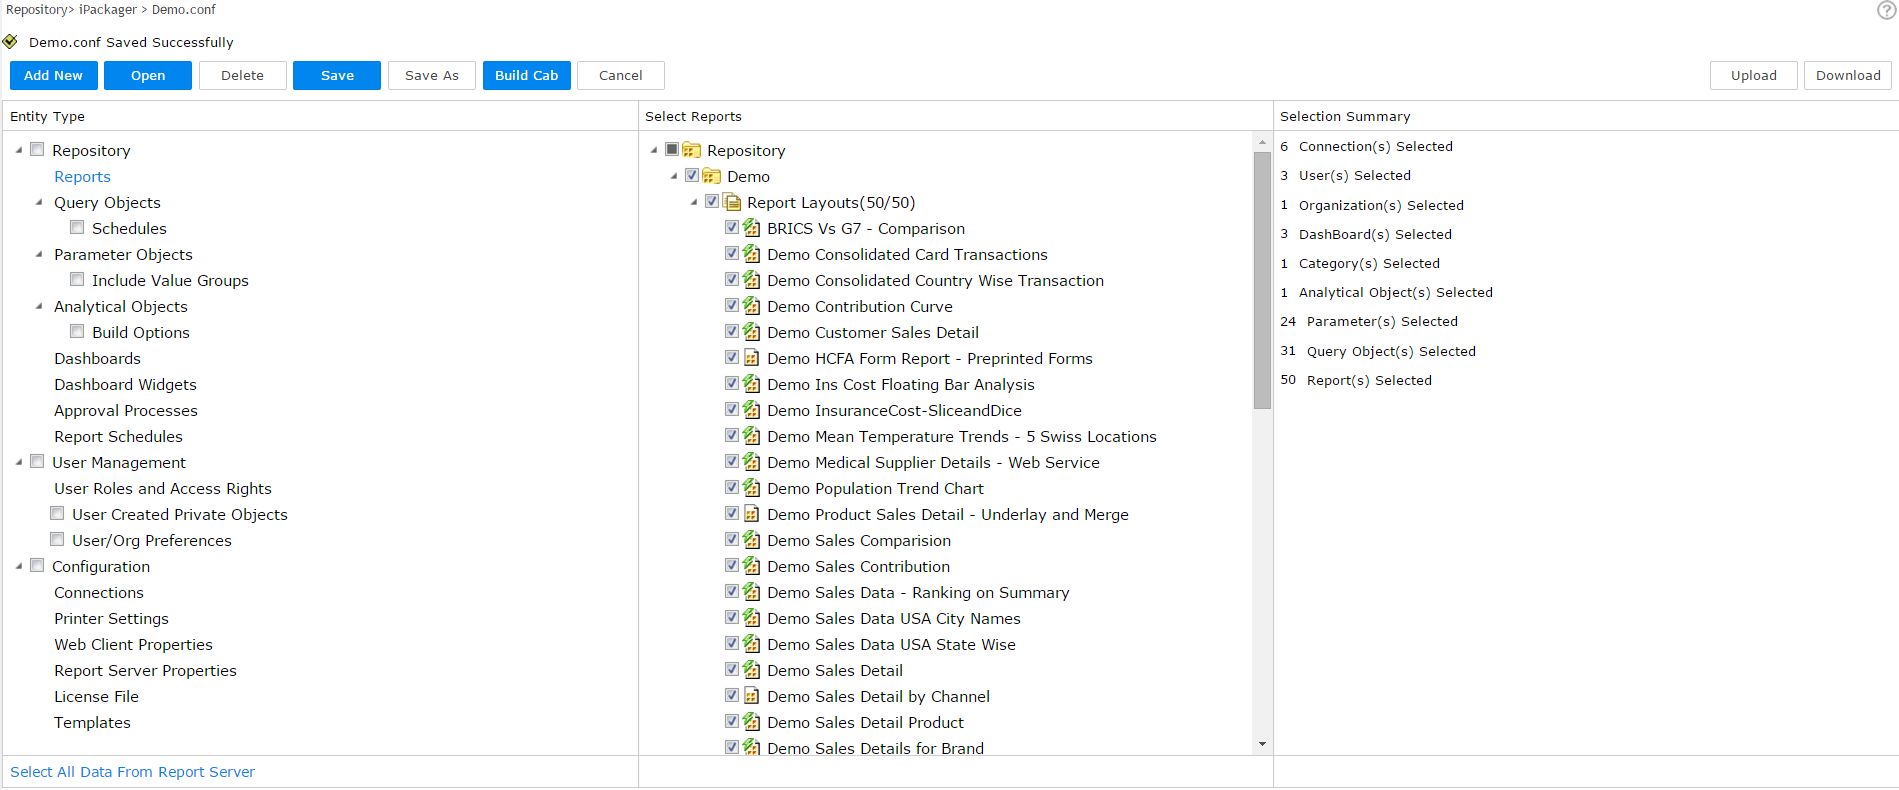
Intellicus announces its all-new Web-based application named iPackager. iPackager is a utility to package repository objects, users’ preferences and configuration settings from Intellicus repository or local file system. This packaged information can then be deployed at any of the installations of Intellicus.
This way, you can use iPackager to setup and maintain Intellicus repository from remote location.
When Intellicus is deployed at multiple locations, iPackager helps save a lot of efforts spent to set up Intellicus repository at each of the locations. This helps eliminate the need of re-doing all the configuration activities at multiple locations.
Intellicus' new browser-based iPackager is compatible with all recent versions of browsers as it does not require Java Applet support any longer.
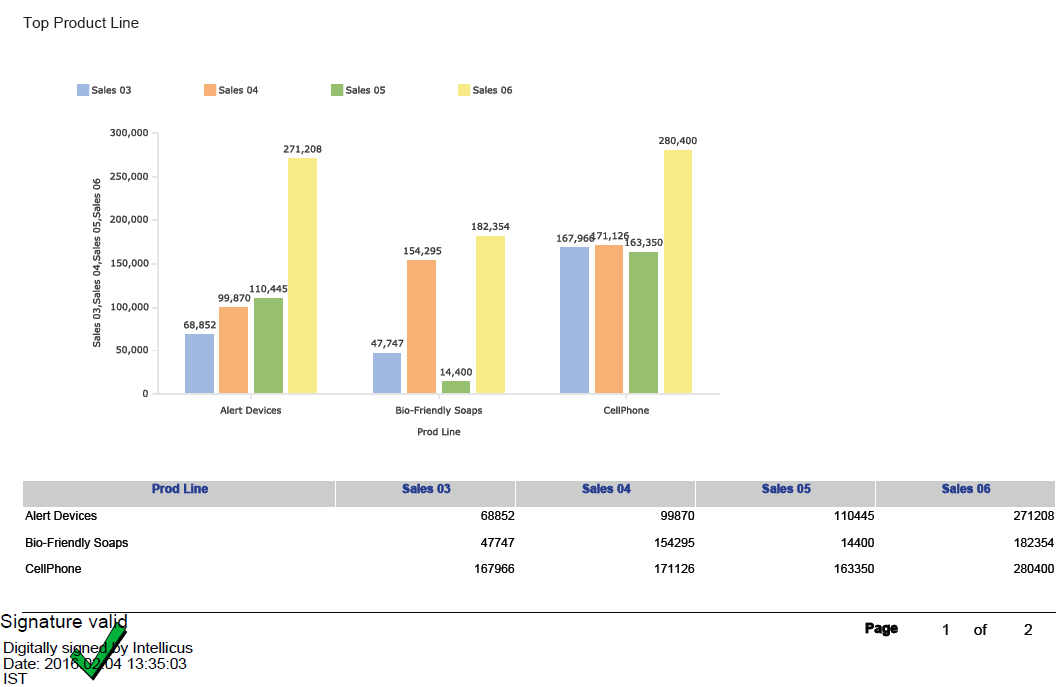
In an attempt to enhance security of data, Intellicus now supports digital signatures on PDF output documents (Intellicus reports). Digital signatures enable to verify the authenticity of the documents while performing ‘View’, ‘Email’, ‘Publish’, ‘Upload’ or ‘Print’ operations. Intellicus accesses the digital signature file from a central, secure location and sign the PDF output at runtime. The digital signature verifies the signer's identity and ensures that the document has not been altered after it was signed.