|
|
|
|
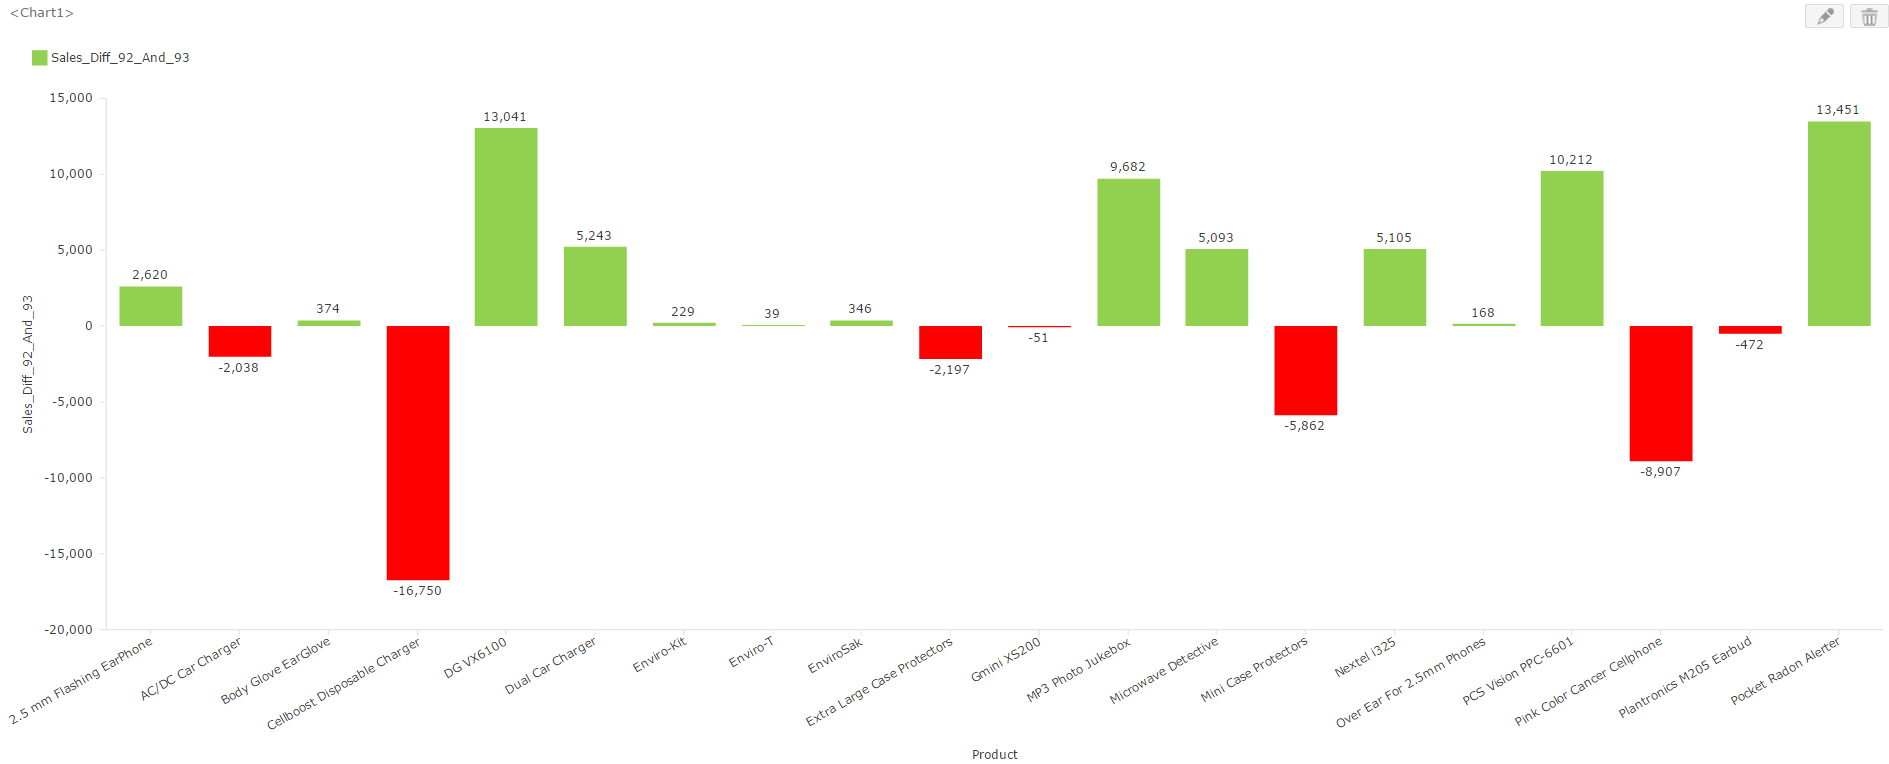
With its enhanced UI, Intellicus supports viewing of "negative values" on charts. You can now assign a color for negative values i.e. values below a specified Negative Base.
The below example shows negative sales values of products between two consecutive years in red color (i.e. values below Negative Base specified as 0).
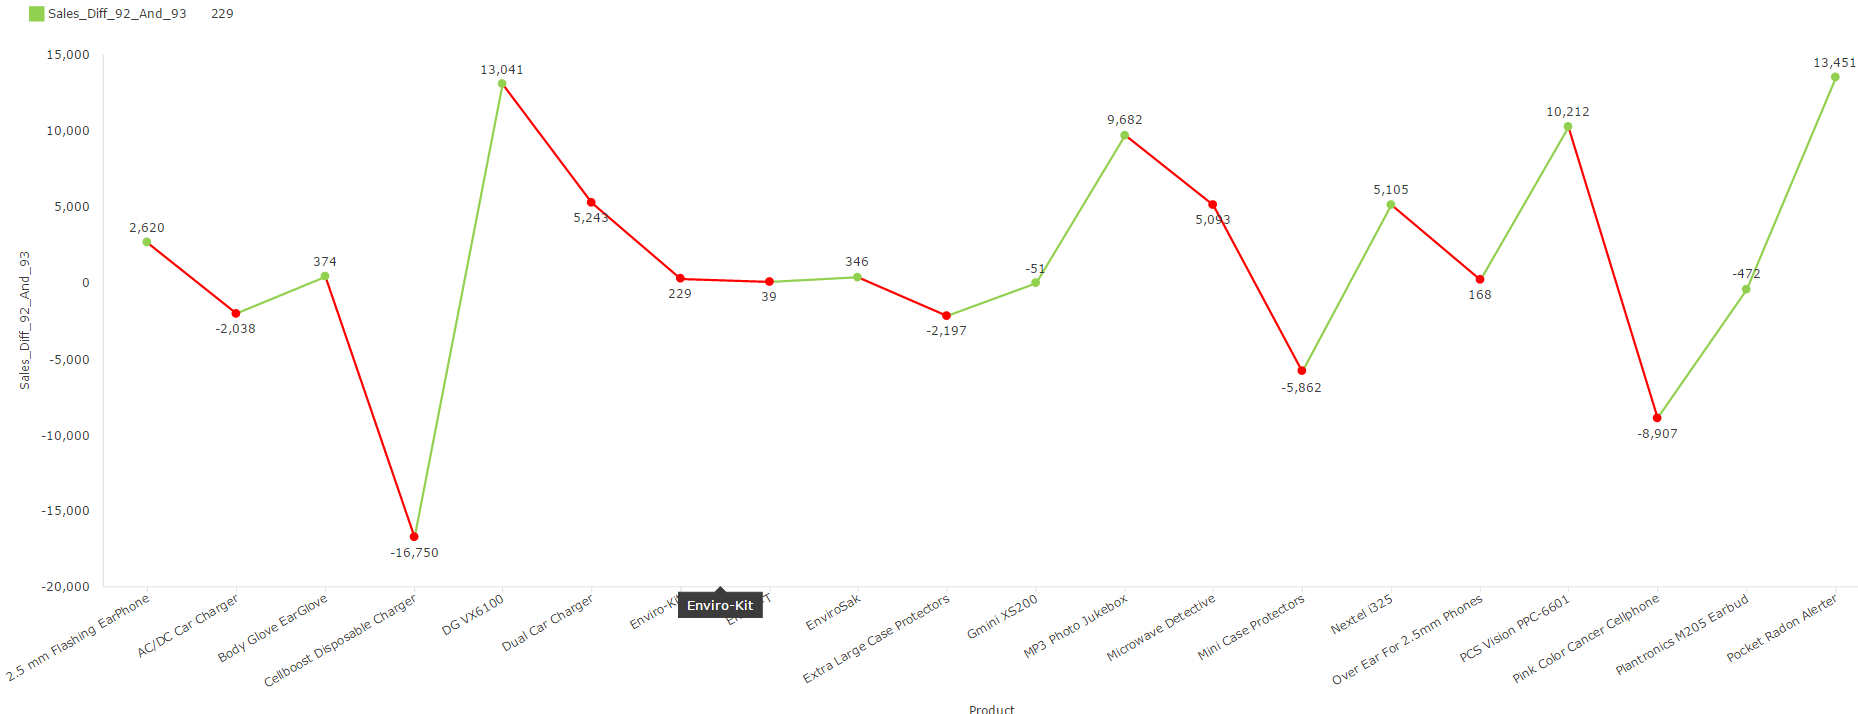
‘Use Negative Color For Decreasing Values’ option enables viewing values following a decreasing trend in the chosen negative color.
A line chart depicting decreasing trend of sales variation of products between two consecutive years in red color is shown below: