|
|
|
|
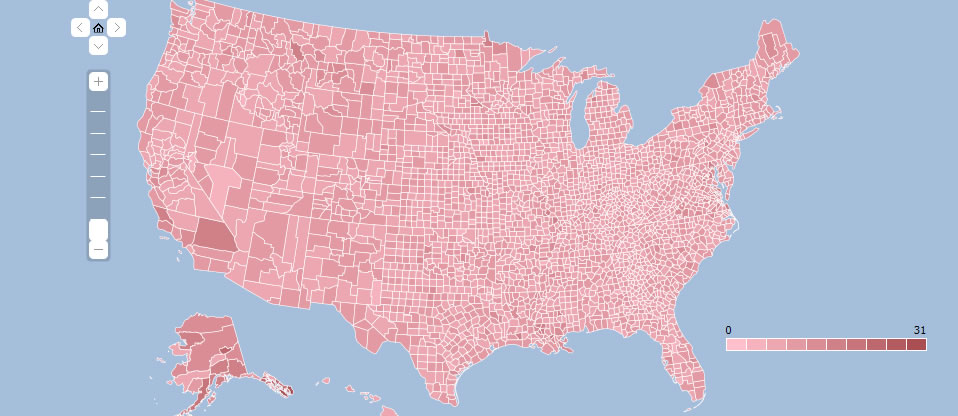
Intellicus 6.3 supports GIS map visualization. GIS map visualization is available on Ad hoc reports and on OLAP viewer.
The functionality provided in this version are drawing heat map, showing attributes and metrics on balloons and drill down to maps, charts or reports.
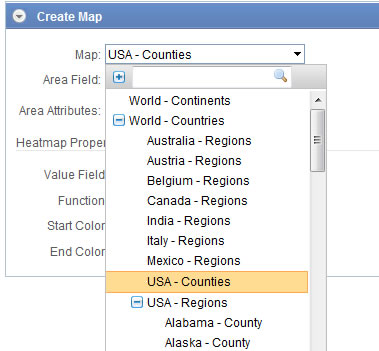
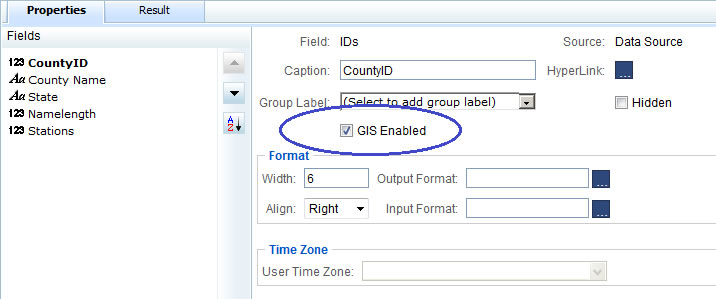
In the Data Model, a query object field can be configured as a GIS enabled field. A GIS enabled field appears in Map settings tab of Ad hoc wizard to be selected as an Area field.
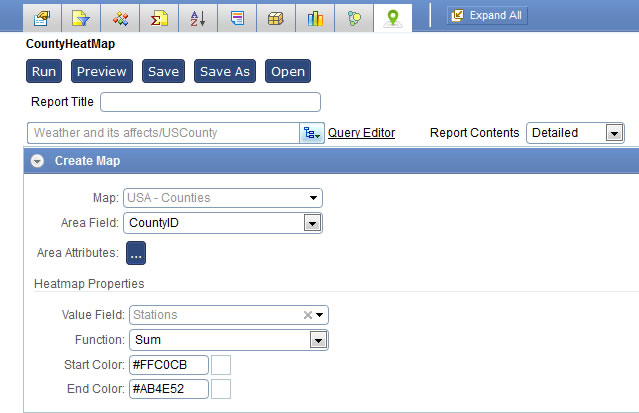
On Ad hoc wizard, a new map settings tab is introduced. This tab prompts for 1) Initial Map level and 2) Area field (GIS enabled field) to draw a map.
Additionally, you can configure attributes text to show on balloon displayed on click of an area.
For generating a heat map, you select the value field with desired summary function and select start and end colors.