|
|
|
|
If you are looking to analyze your data on timelines and want to apply various trend algorithms, Intellicus ad-hoc charting is ready to provide you trend lines.
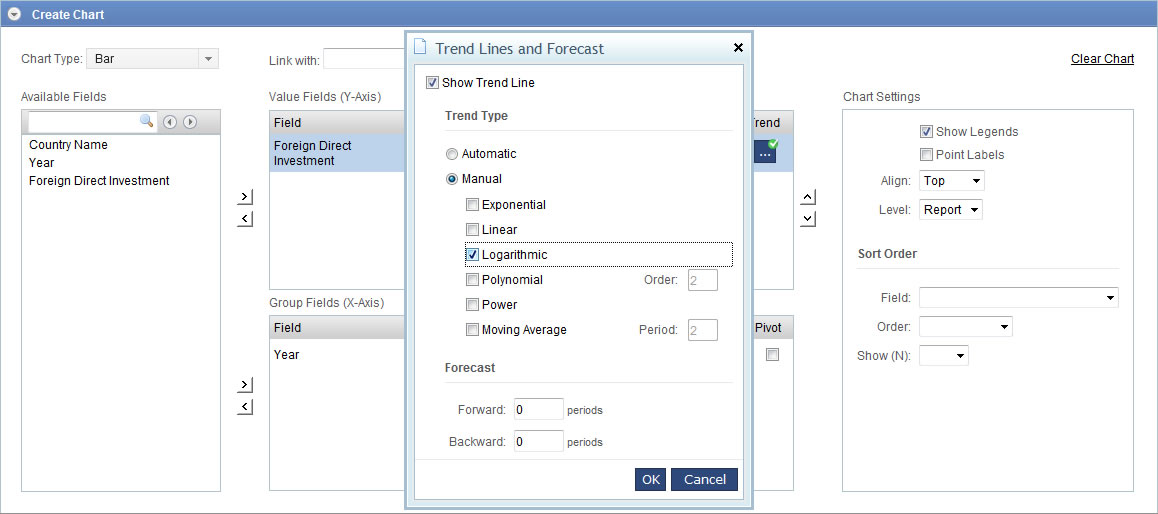
On the Ad-hoc chart wizard, you can select a value field and open trend line dialog to choose one or more trend algorithms to draw trend lines. Intellicus also provides an automatic selection of best applicable algorithm based on the data at runtime.
Adding Trend line to a chart
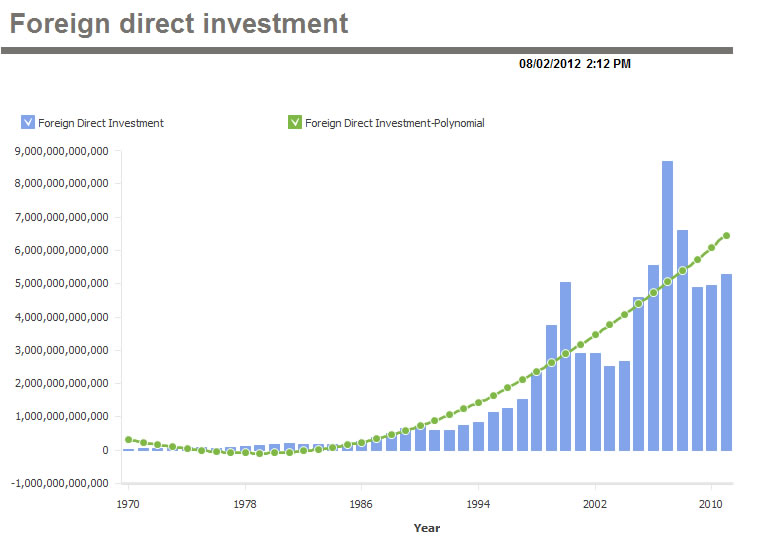
Trend line using Polynomial function
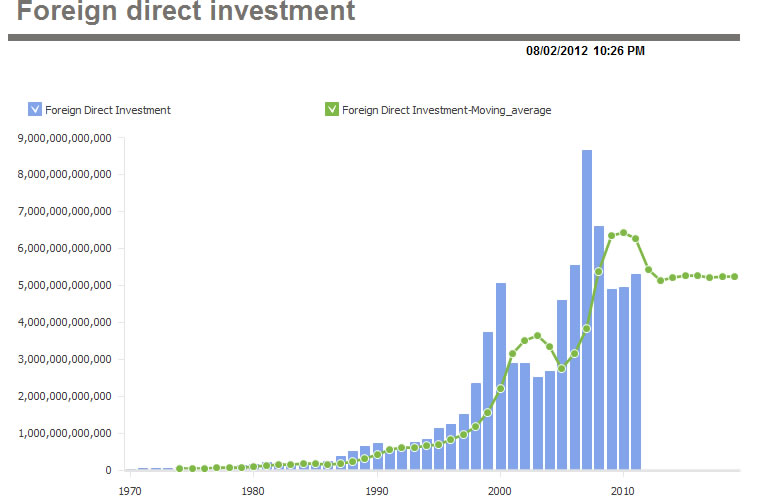
On a report output, using the power viewer, you can add trend lines to a chart. The chart legend shows the algorithm name of the manually selected or automatically applied trend function name. You can interactively switch on or off each trend line to compare among them and actual data.
You can extend the trend lines to predict forecast values. We support both forward and backward predictions. The forecasting should be assumed as in the same units as the actual data. Generally we advice to forecast not more than 10-15% extended units of input data, for example if you have 40 input data units, forecast 4-6 units. Although we don't put any restrictions in this regard.