 Enterprise Reporting & Business Insights Platform Enterprise Reporting & Business Insights Platform |
 Enterprise Reporting & Business Insights Platform Enterprise Reporting & Business Insights Platform |
New versions of browsers are supporting JavaScript and HTML5 content. Intellicus 6 brings JavaScript charts as its primary interactive charting component.
JavaScript charts do not require any plug-in like flash charts would do. They run faster and smoother, and consume lesser resources on the browser.
All of your Ad-hoc reports and dashboards that may start showing as JavaScript charts will not be any different in visual appearance or interactivity from the flash charts.
For any purpose if you still need flash charts, you can change the template settings.
You can relate conditions using AND/OR operators and group them using braces.
Earlier Ad-hoc conditions were always related to using AND operator automatically. Now the Ad-hoc Wizard gives you the option to choose the relation operator and the braces to group multiple conditions.
Overall for a simple report this might seem complex, but for a power user, this enhancement will be very handy.
Your administrator may choose to switch ON or OFF this feature in your deployment.

Similarly conditions in the Highlighting section can also be related using AND/OR operators and can be grouped using braces.
You can apply multiple Highlighting styles based on multiple conditions. The highlighting styles are so enhanced that the styles apply incrementally.
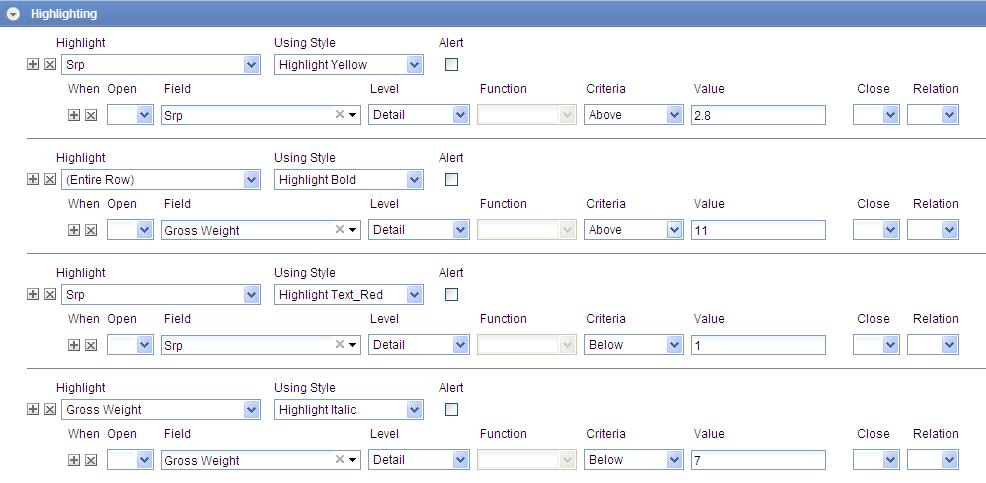
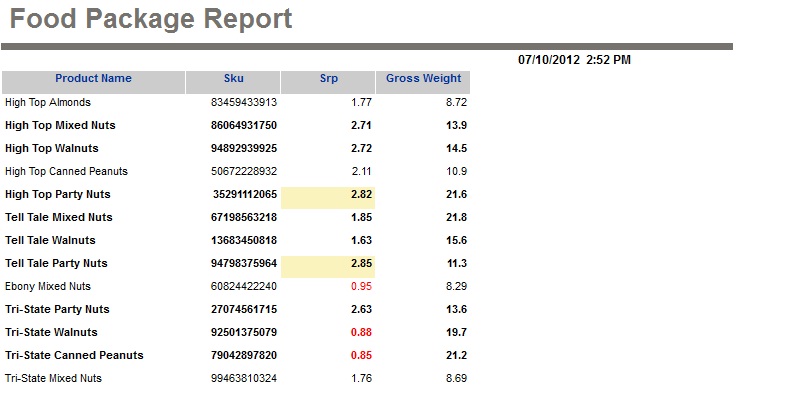
In this given example, condition1 is setting color Yellow, condition2 is setting weight as bold and so on. On a given row/field all the styles may concurrently be applicable.
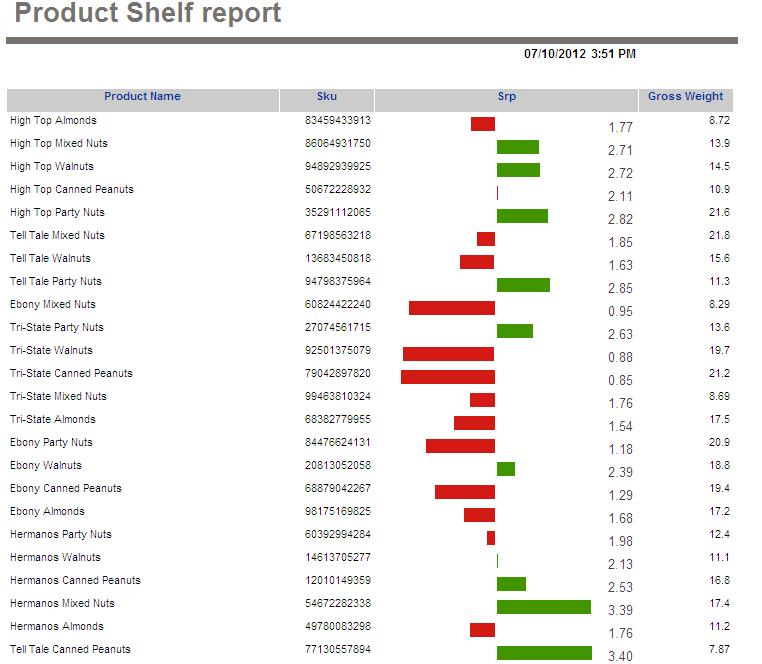
Intellicus 6 supports rendering a number field as a Data bar control. On the Ad-hoc Wizard, for the selected number field, choose 'Render as' option and choose 'Data bar', and specify the base for the bar.

As shown in above figure the SRP is rendered as data bar based on its own average. For all values of 'Srp' lesser than its Average, the bar will be Red, and for all values greater than the average it will be Green. The size of the bar will represent its difference from the average value.
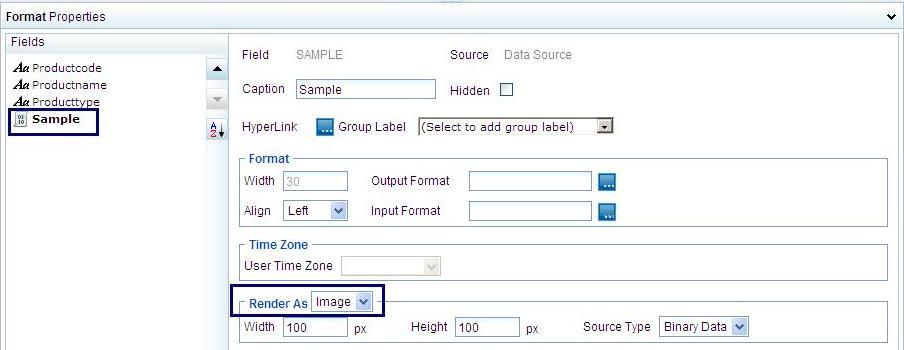
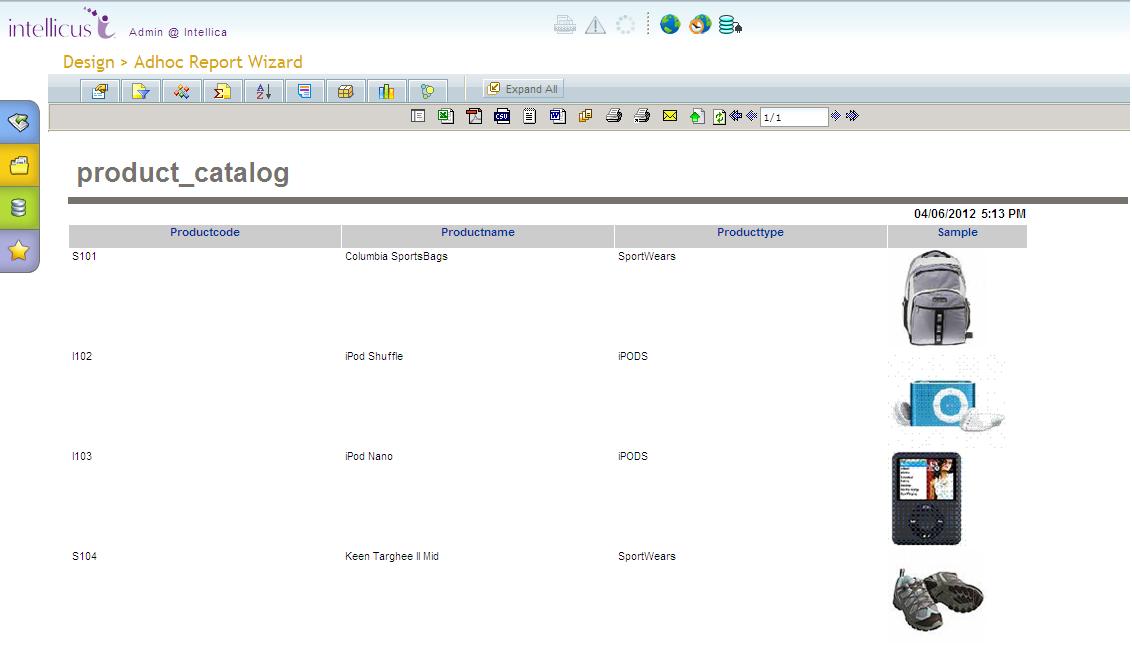
Intellicus 6 provides support for rendering Images stored in database tables on Ad-hoc reports. The Query Object supports Binary data type fields which stores images in a database. When you create a Query Object for the binary fields, which contains the images, you have to set "Render As" attribute as "Image".
When End users drags this field on their reports, they will see the images!
Example - Images in Ad-hoc Reports
Networks assist in depicting associativity and relations between entities in a graphical form.
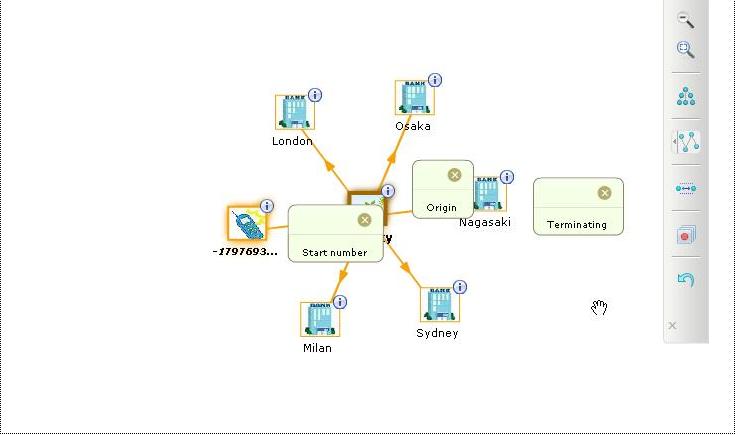
Intellicus 6 provides Network Graph control, to analyze relations between entities. This Chart enables a user to do conditional plotting, traverse a path and save it, Dig deep into the data at various levels and see the relationships that exist. Users can also use various images to separate out the nodes.
This Easy to use Chart is available in the Ad-hoc wizard as a Separate TAB/Section and adds another dimension to the Ad-hoc analysis capacity of Intellicus.

This Designed Graph shall look like this on execution.
Note:- Currently the Support of Network Chart is available in the 'iHTML' format only.