Release Notes |
Adhoc Reporting Enhancements
Intellicus 5.0 introduces better visualization of your business data, thru new charting and data grid, for your reports. The new charting provides flash based rich charts. The new data grid comes with cutting-edge functionality, allowing you to group and filter data much-more interactively, as explained below.
Interactive Charting
New Data Grid Control
Ranking on Groups
Top(N) support in Adhoc chart
Link Chart with Report Data
Preview Facility
Enhanced Adhoc Template Configuration page
Interactive Charting
In order to provide a highly interactive charting experience to Intellicus users, a new charting library is now integrated with Intellicus 5.0. These charts provides on-demand zooming, scrolling and showing or hiding series data.
Designer can set values of various properties of these charts through templates to make appealing charts. Intellicus provides some predefined sets of chart templates which carries right set of properties and their values.
These charts also provides advantage of client side interactivity. This saves sever-trip for interactive operations performed by end users and provide quick refreshing of the charts.
These chart are available for HTML and iHTML report outputs of Adhoc reports.
Following are screen shots of Donut, Radar and Bar Interactive charts.


New Data Grid Control
Intellicus 5.0 also integrates a new Data grid, to improve the performance of interactive operations on report outputs. Data grid provides fast response for interactive Reporting operations like searching , sizing of columns and re-positioning of columns. Integration of this grid also reduces server trips.
The look-and-feel and initial grouping (grouped/detail) of the grid can be specified using CSS (and properties) based Templates. Some predefined grid templates are available which can configured and used. You can also design your own templates based on requirement.
Data grid is available for iHTML report output of Adhoc reports.

Intellicus also introduces a feature to rank groups based on value of other fields.
Ranking on groups can be defined from Select grouping section of Adhoc Report Wizard (Design > Adhoc Report Wizard).

Top(N) support in Adhoc chart
Now you can define Top(N) settings in Create Chart section of Adhoc Report Wizard(Design > Adhoc Report Wizard). This feature provides facility to filter data on chart based on N sorted values of specified summarized field.

Link Chart with Report Data
Intellicus has introduced feature of linking Adhoc chart with tabular part of report .This feature provides effect that any design changes done in tabular part reflects similar changes in Chart. It is using grouping and summary information of tabular part of report for creation of chart.
You can use this feature from Adhoc Report Wizard and Power viewer. On checking Link Chart with Report Data option ,Groups or first character field in report become X-axis of Chart and Group level totals (summary) or first numeric field in report become series (Y-axis) of chart.

Adhoc report output with grouping on Product Type and Summary field as Total Sales Amount.

When grouping add on Product Line then chart also updated with tabular portion of report.

Preview Facility
This Intellicus release also introduces a Preview Mode feature on Adhoc Report Designer.
The Preview option helps you check look and feel of report with limited number of records after changes in report design.
Additionally, for quick execution of report preview, Intellicus implements data caching for similar SQL queries.
Preview Mode is provided on following screens.
- Adhoc Report Designer
- Run Adhoc Report
- Power Viewer
Number of records for report preview is configurable by report server property Report Preview Record Count.


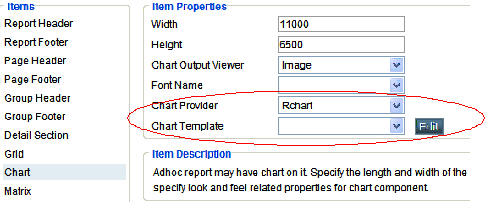
Enhanced Adhoc Template Configuration page
Adhoc Template Configuration page is enhanced for configuration of new components and new output format.
Following modifications are done on this page.
- Group Indent Width and Include Groups in CSV properties is moved to Group Header section from Misc. section.
- Added Chart Provider and Chart Template properties on Chart section.
- Added Grid section.
- Misc. section changed to iHTML section.