|
|
|
|
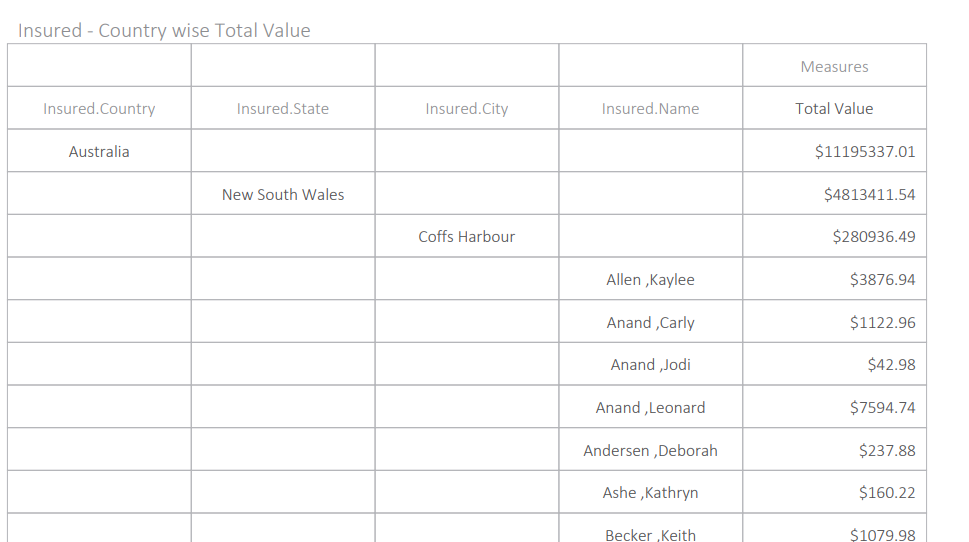
Intellicus enables you to view your detailed data in exported file. You now have the option to expand levels of hierarchy in High Speed crosstab.
Below is an exported report that shows all levels of hierarchical data.
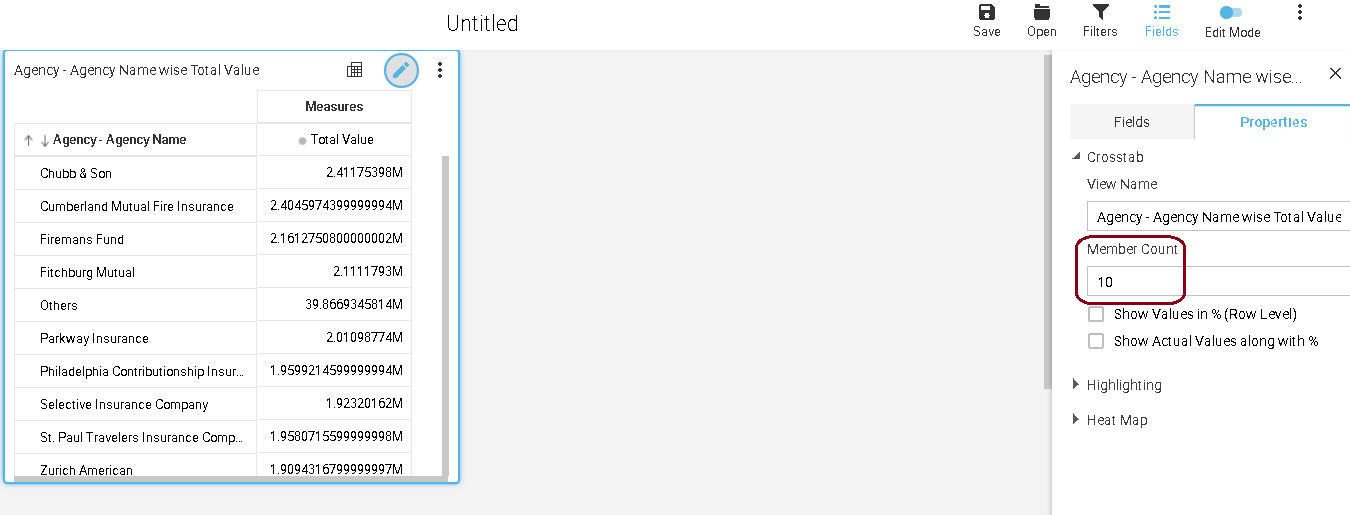
With previous versions of Intellicus, you could set the value of OLAP MEMBER COUNT property only through ReportClient_Default.properties file. This feature lets you change the OLAP member count value to dynamically fetch the specified rows.
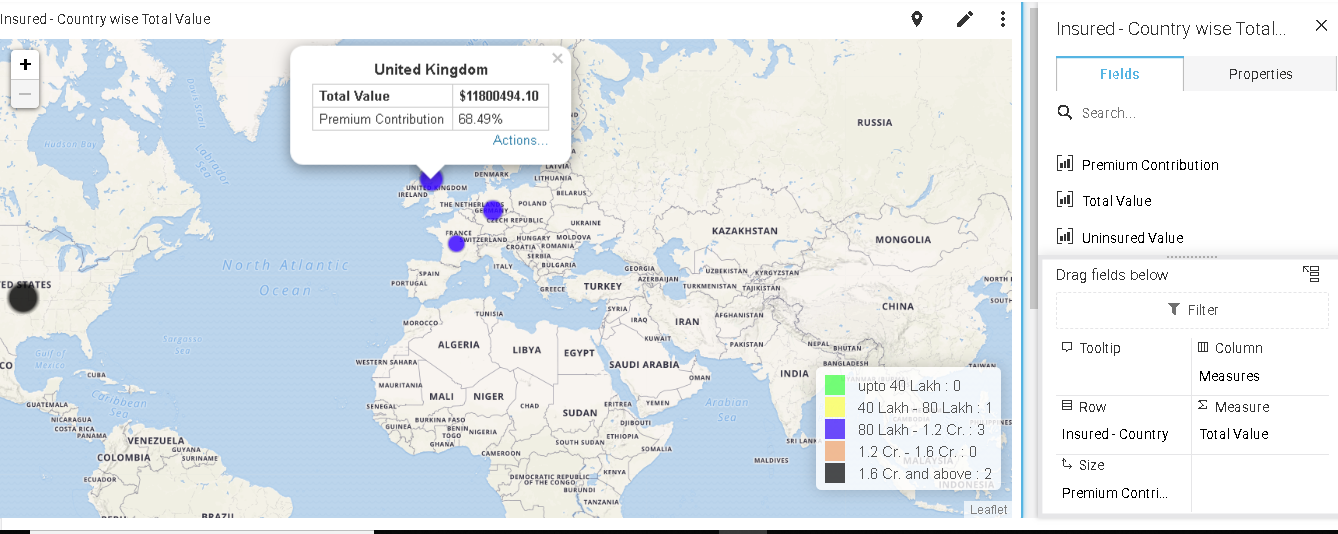
With Intellicus' GIS maps in High Speed reports, you have the option to specify the sizes of bubble depending on the value of selected measure.
The properties corresponding to the minimum and maximum size of the bubble should be added in the map.imt file.
Below screen demonstrates an example showing "Premium Contribution" of Insurance to govern the size of bubble in map location wise.
Intellicus 19.1 has extended support of the following statistical functions to aggregate data:
To achieve this, you have to specify either primary key of the Fact table or a composite key that can uniquely identify a measure value.
This key when combined with the measure values will create distinct measure values.
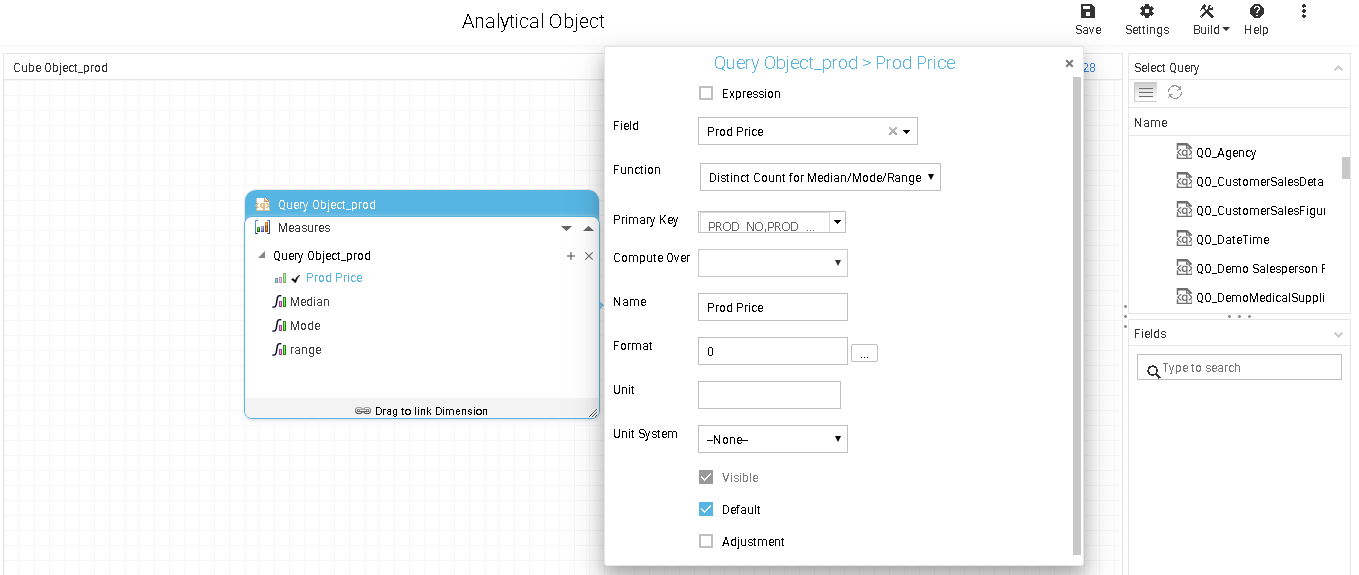
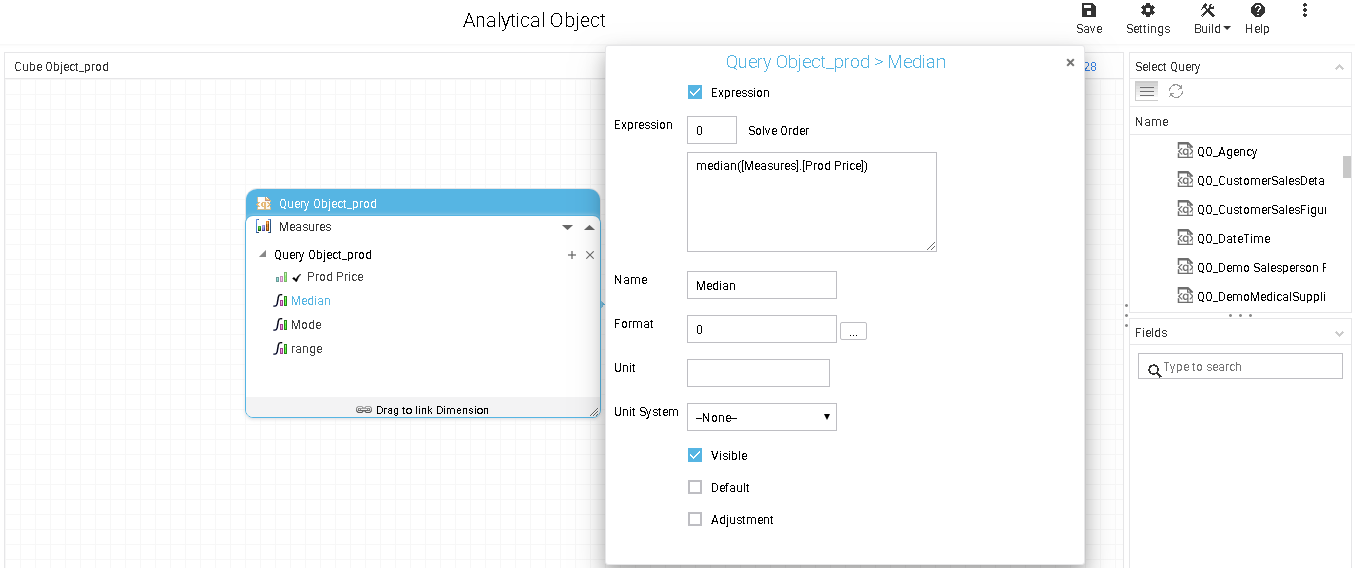
To calculate the median/mode/range you need to add another new calculated measure with following MDX respectively:
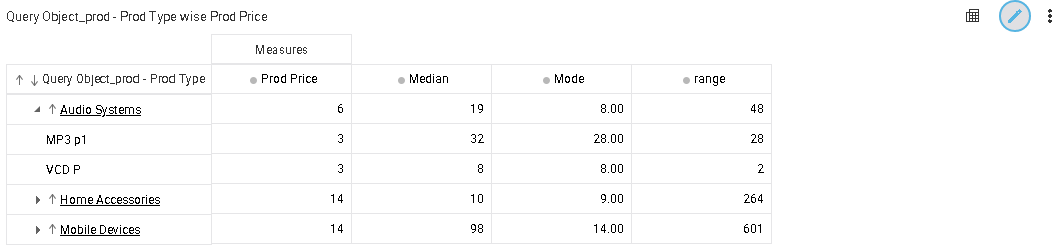
A sample report showing Median, Mode and Range of product price is given below:
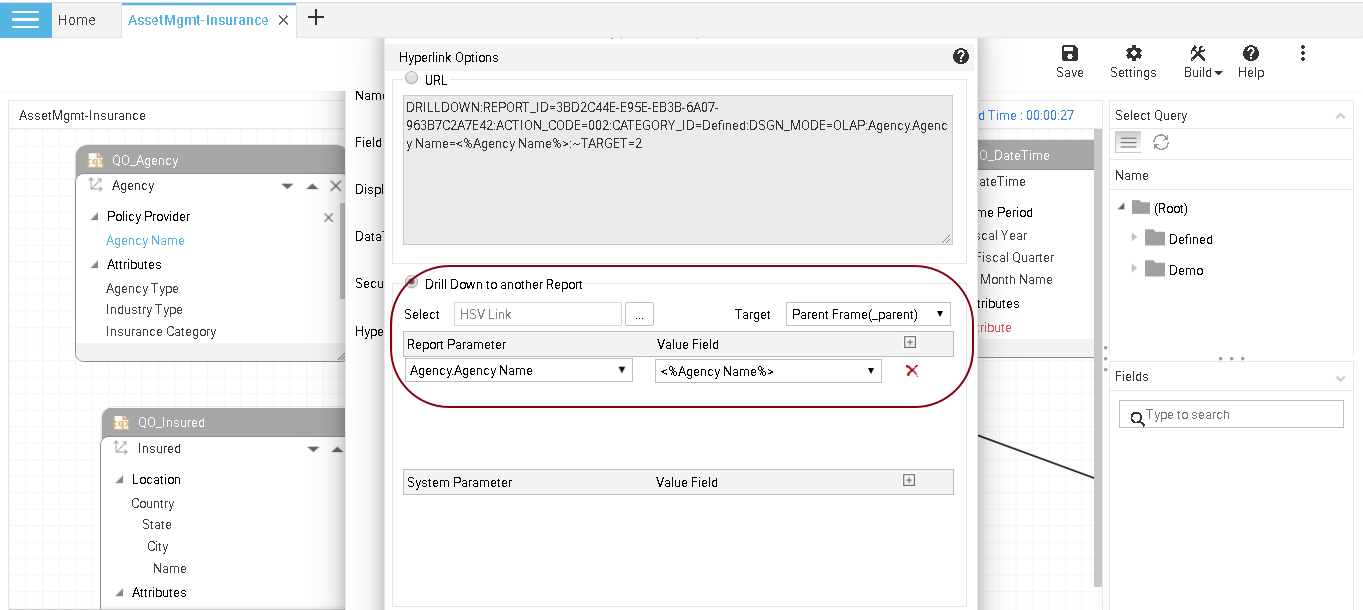
When designing analytical object, you can specify filter parameters for the hyperlinked High Speed report in hyperlink options window.
These report parameter options should contain all the levels of each dimension present in the selected report. This enables to pass filter values to the linked report.
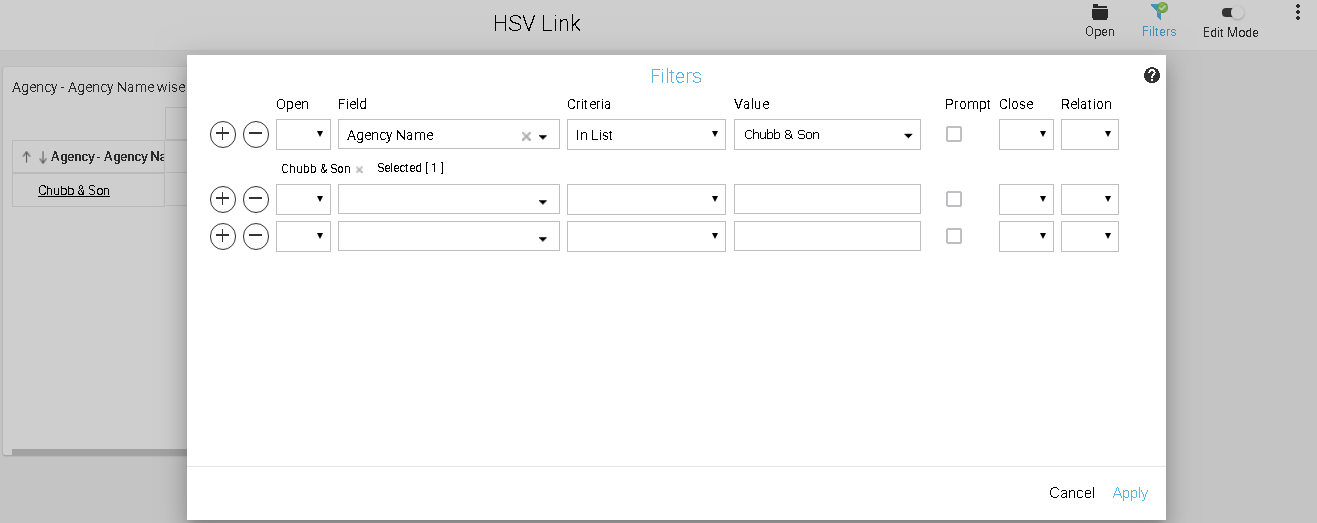
Now, when you select the same dimension level on which hyperlink is applied, you can view the selected report with the specified filters applied by default.
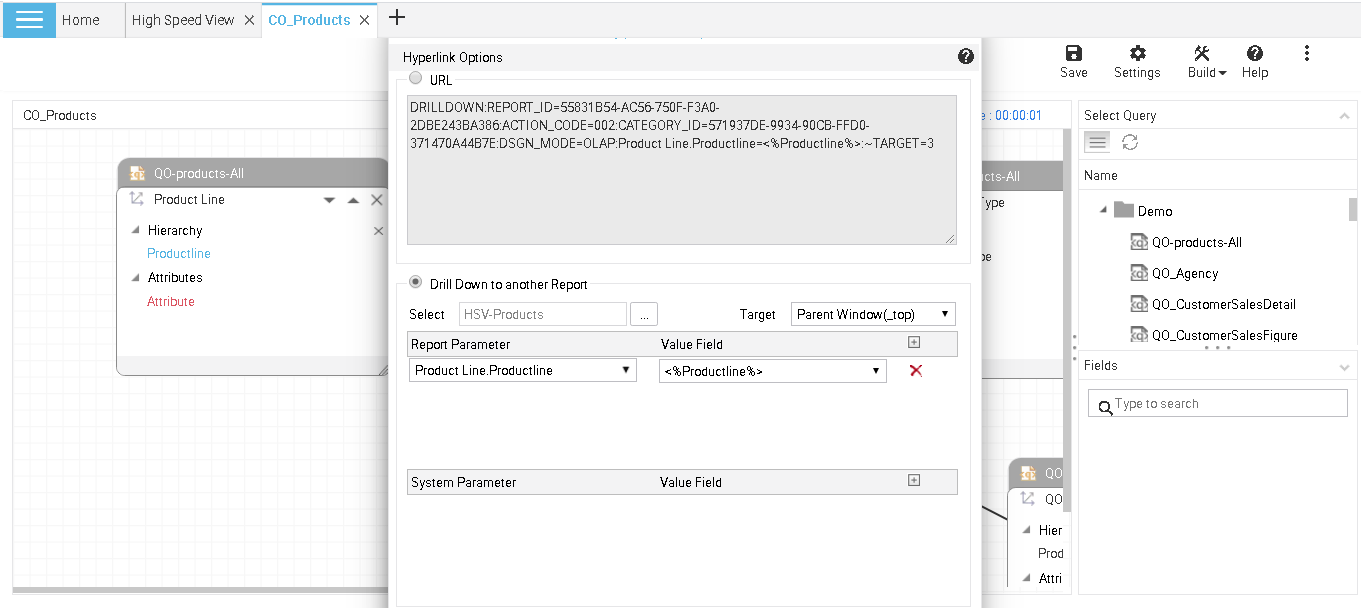
You can specify filter parameters for the hyperlinked High Speed report in hyperlink options window on Analytical Object.
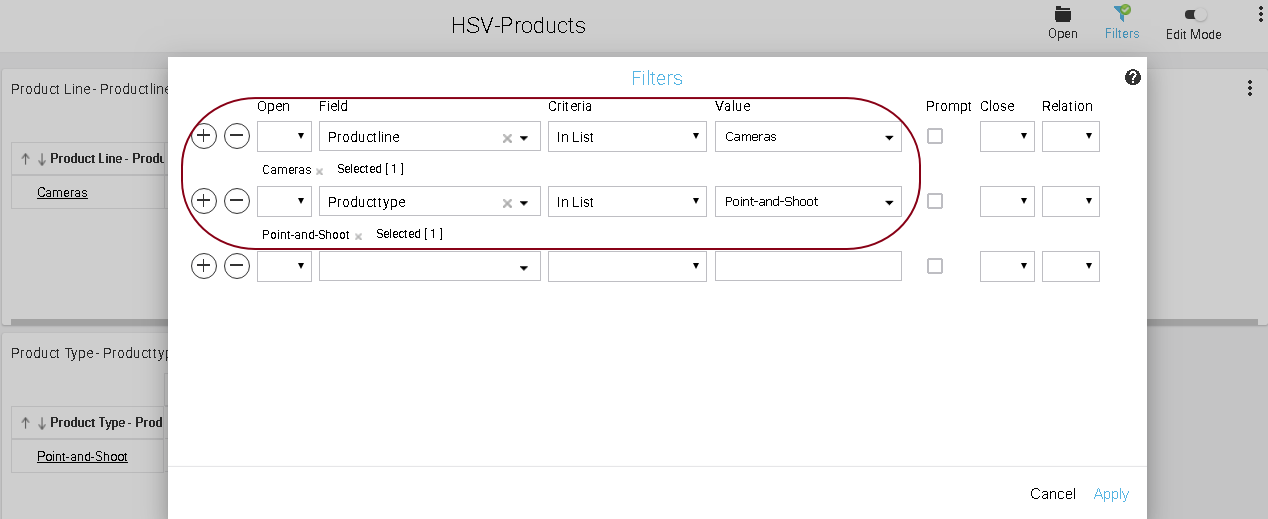
Now, when you select the same dimension level on which hyperlink is applied, you can view the selected report with the specified filters along with parent filters.
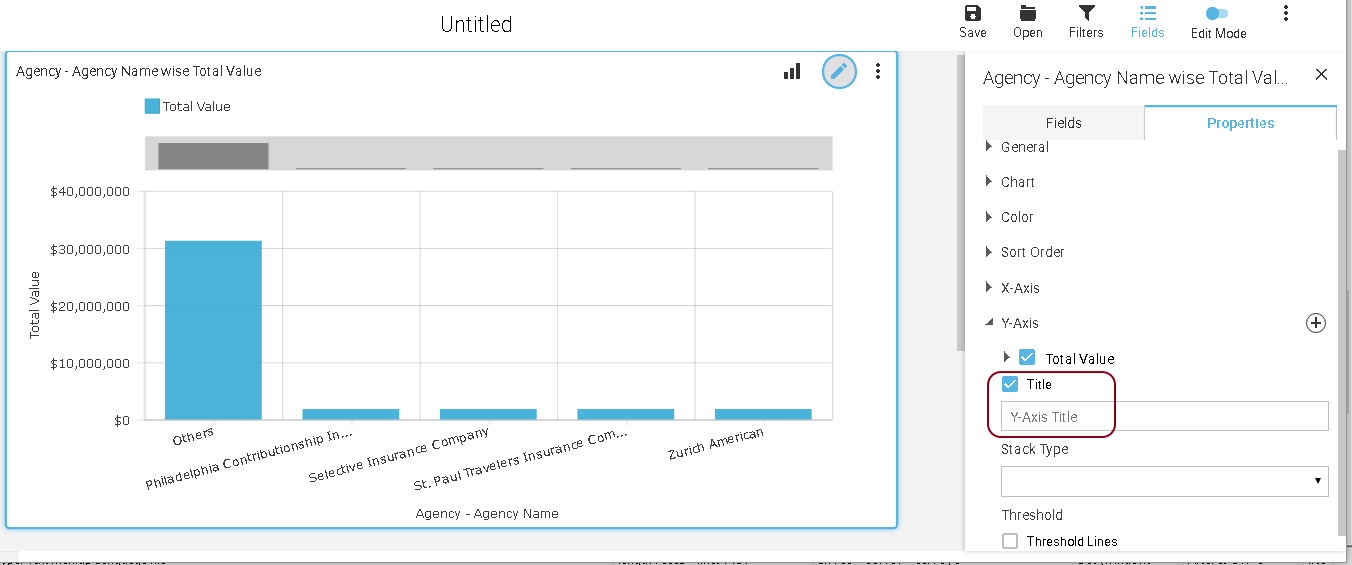
This enhancement lets designers choose the option to show or hide Y axes titles through a chart property on portal for High Speed reports.
This property can be selected for multiple Y axes.
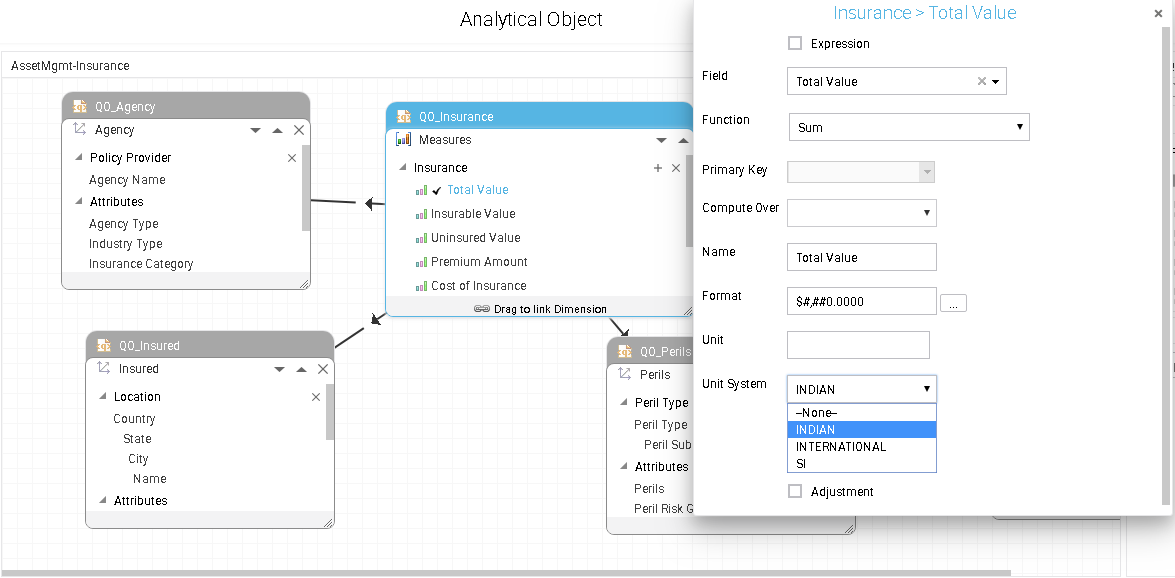
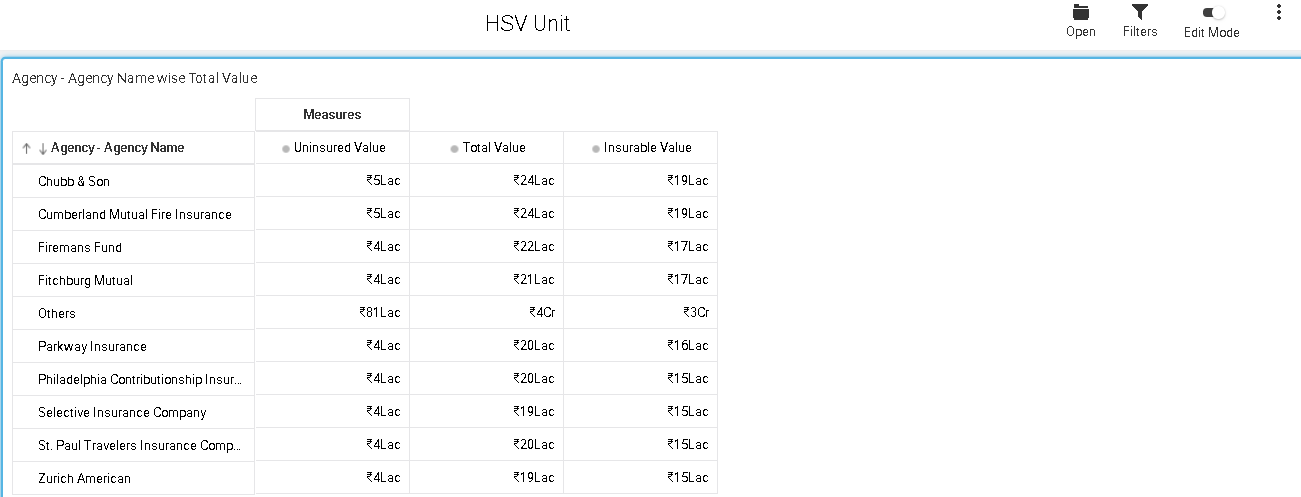
This enhancement provides the option to display the numeric values in crosstab/chart/map with formatting as per the unit system.
Currently Intellicus provides Indian, International and SI Units. This unit system option is available in the field details window of Analytical Object.
This option is visible on measure field only. You can select Indian unit system to show values in Thousands, Lacs etc. International unit system can help specify USD currency suffixed with Million, Billion etc. Specify SI unit system to show international numeric values in Giga,Tera etc.
Below is an example of specifying Indian system unit and how it will appear on the High Speed Report (with unit system applied).