|
|
|
|
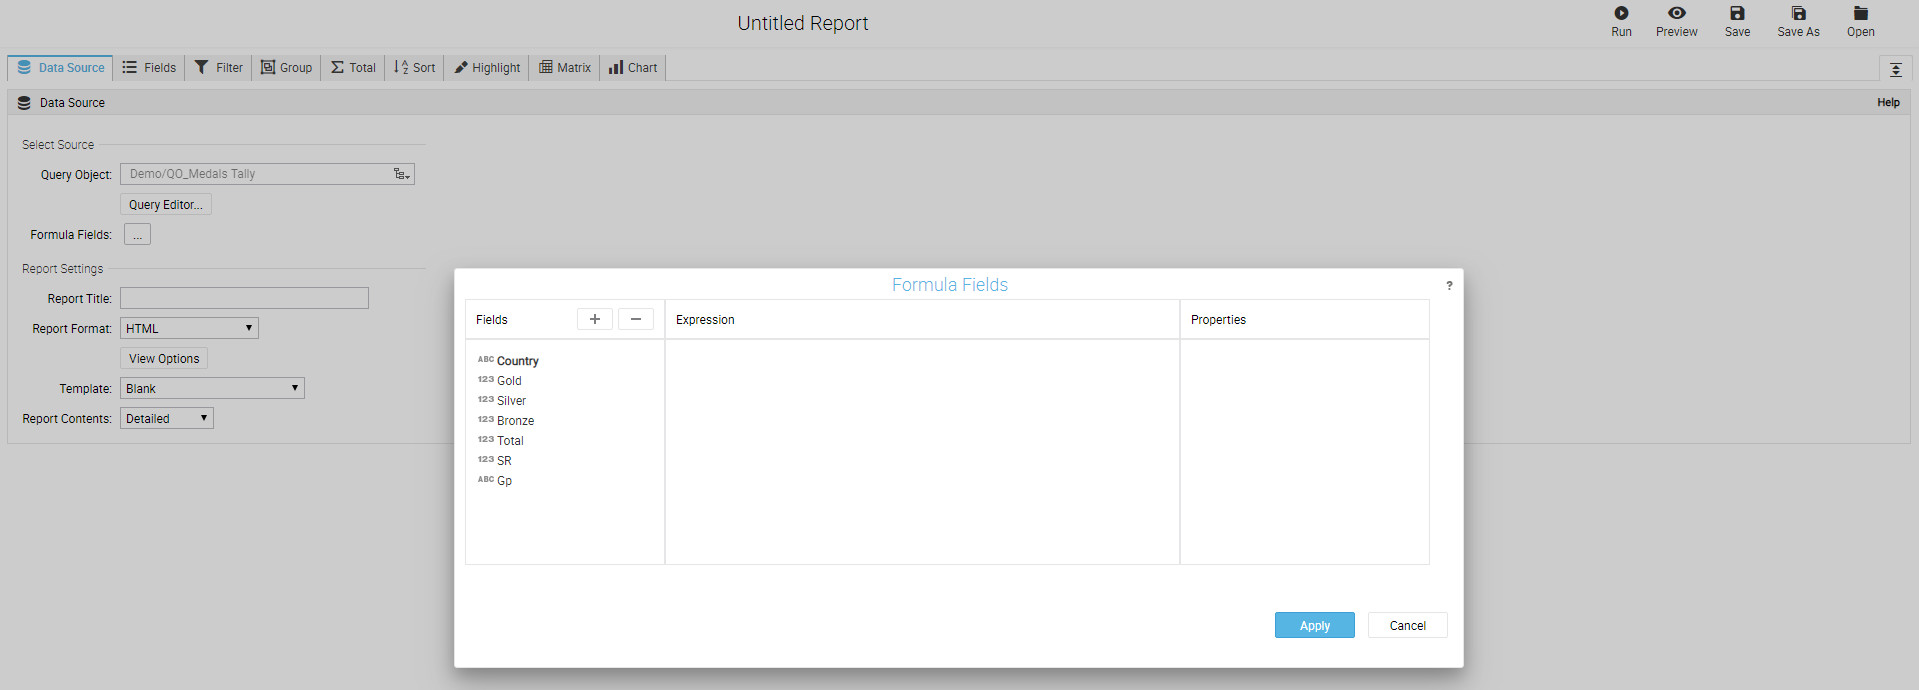
With Intellicus 19.0, you can add formula fields in ad hoc reports at design and run-time. Formula Fields allow you to add calculated fields that are populated at run time without modifying the query object.
A formula field is added to specify a formula expression that can use existing field(s). This formula field can be treated like any other field on grid, chart or matrix in the report.
While designing a report, 'Formula Fields' option is available under Navigate > Design > Ad hoc Report appears as shown below:
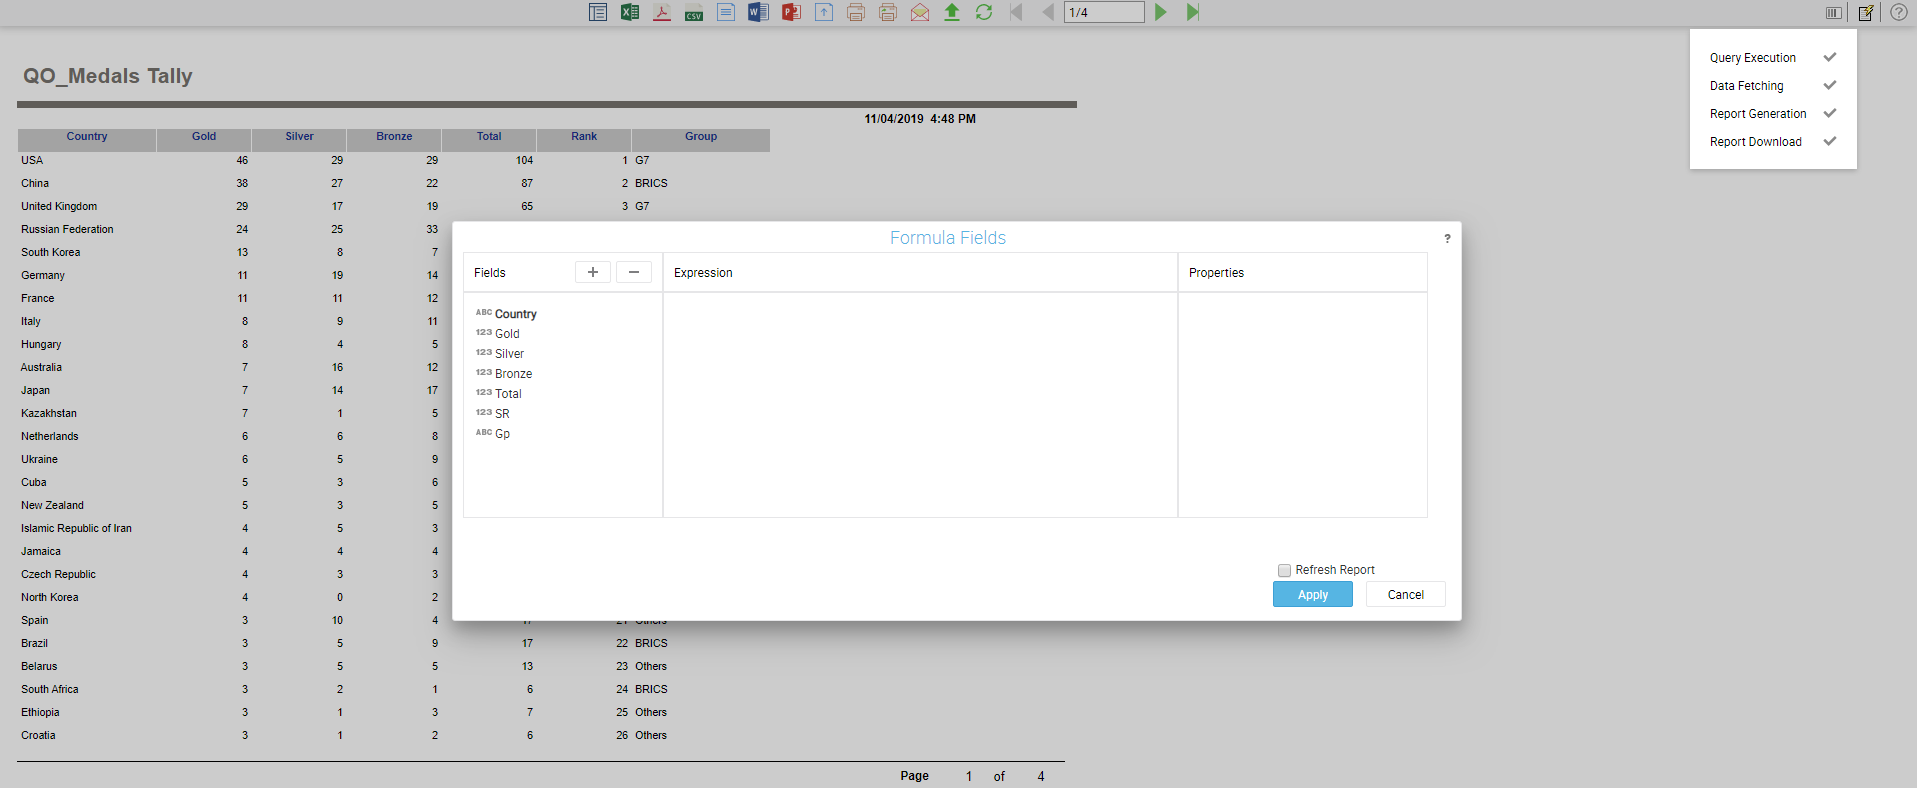
You can add Formula Fields at run time by right-clicking anywhere (except column header) on the Ad hoc Report viewer as shown below:
When running a report containing chart in Intellicus 19, the data aggregations like group by, sorting, filtering etc. are now performed at the database source in case of any RDBMS or analytical database.
Intellicus receives the aggregated data from the respective database source to be written to a view or report. In previous versions, the aggregations were performed at Intellicus Report Engine end on the fetched data.
This feature enables Intellicus to utilize the data processing capabilities of various RDBMS data sources and provide improved performance in rendering reports.
For non-RDBMS data sources (like CSV, Excel), the aggregations are still performed by Intellicus using its staging database, after fetching all the queried data.
In smart reports, aggregation works in the following ways:
For ad hoc and standard reports, aggregation does not happen if the report has a grid control.
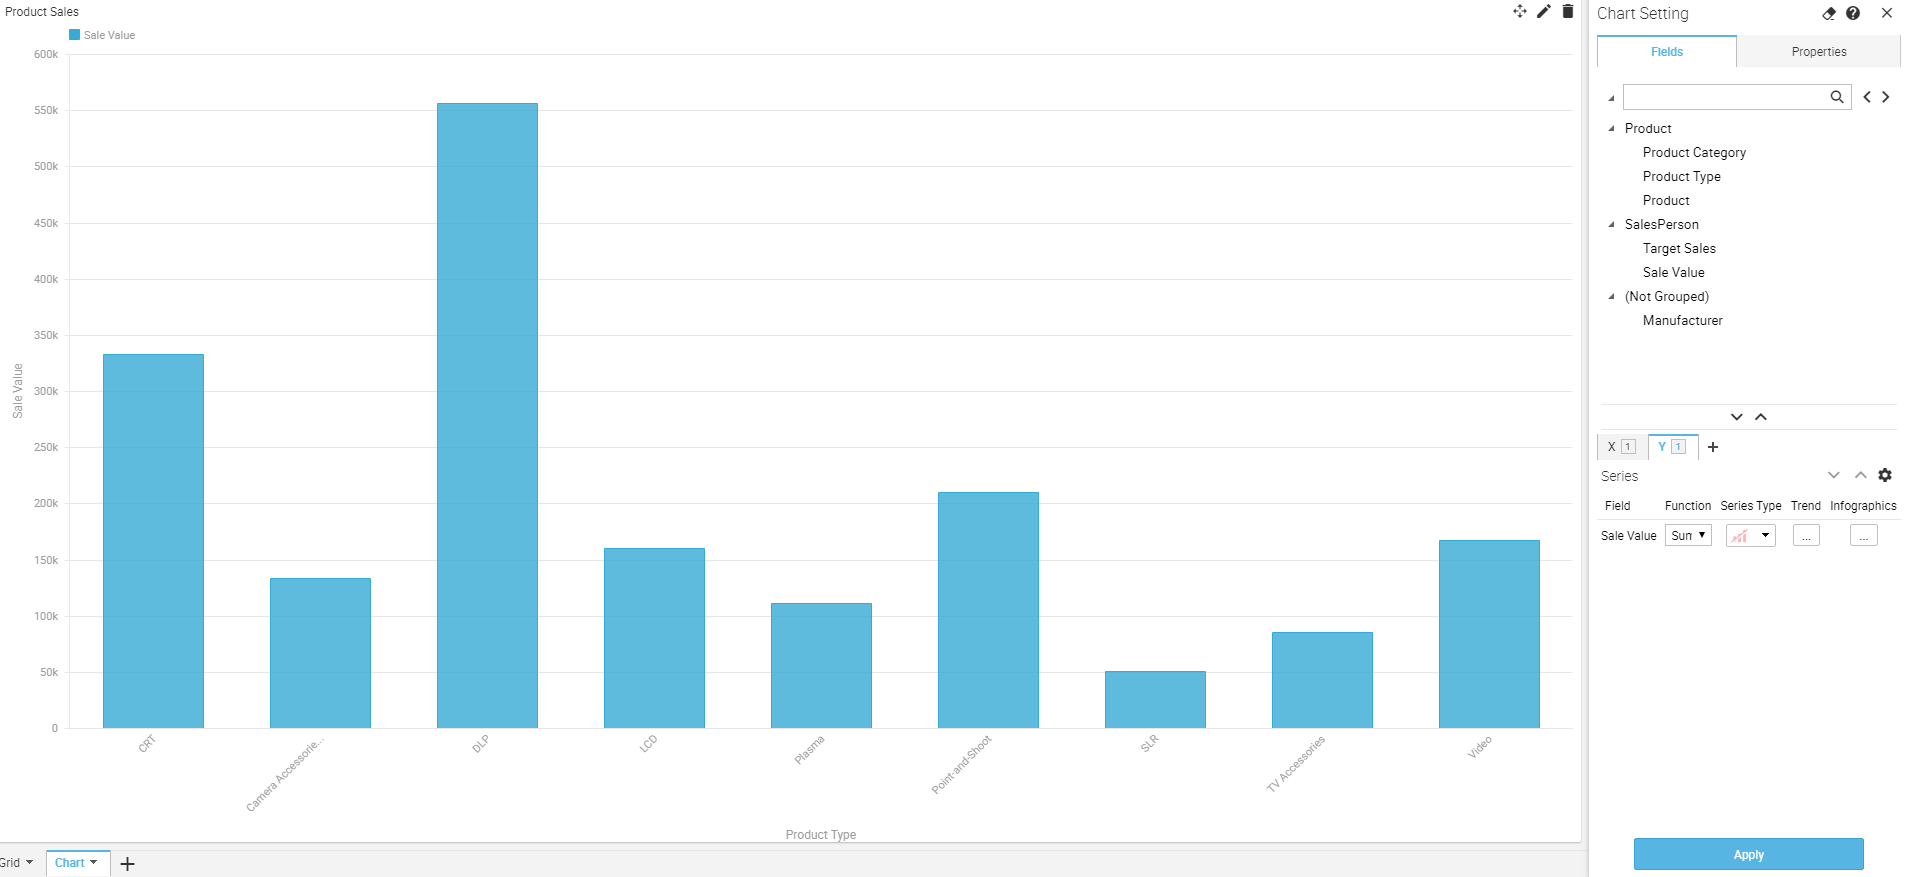
In Intellicus 19.0, you can apply and view the chart settings in parallel while designing. You can now quickly make changes to the chart in the right pane and view the effects on the left pane of the report screen.
With Intellicus you can perform What-if analysis to view predictions of different fields based on various business scenarios. This will help you to make planned decisions of your future actions for your business and any other operational decision based on the predictions you derive.
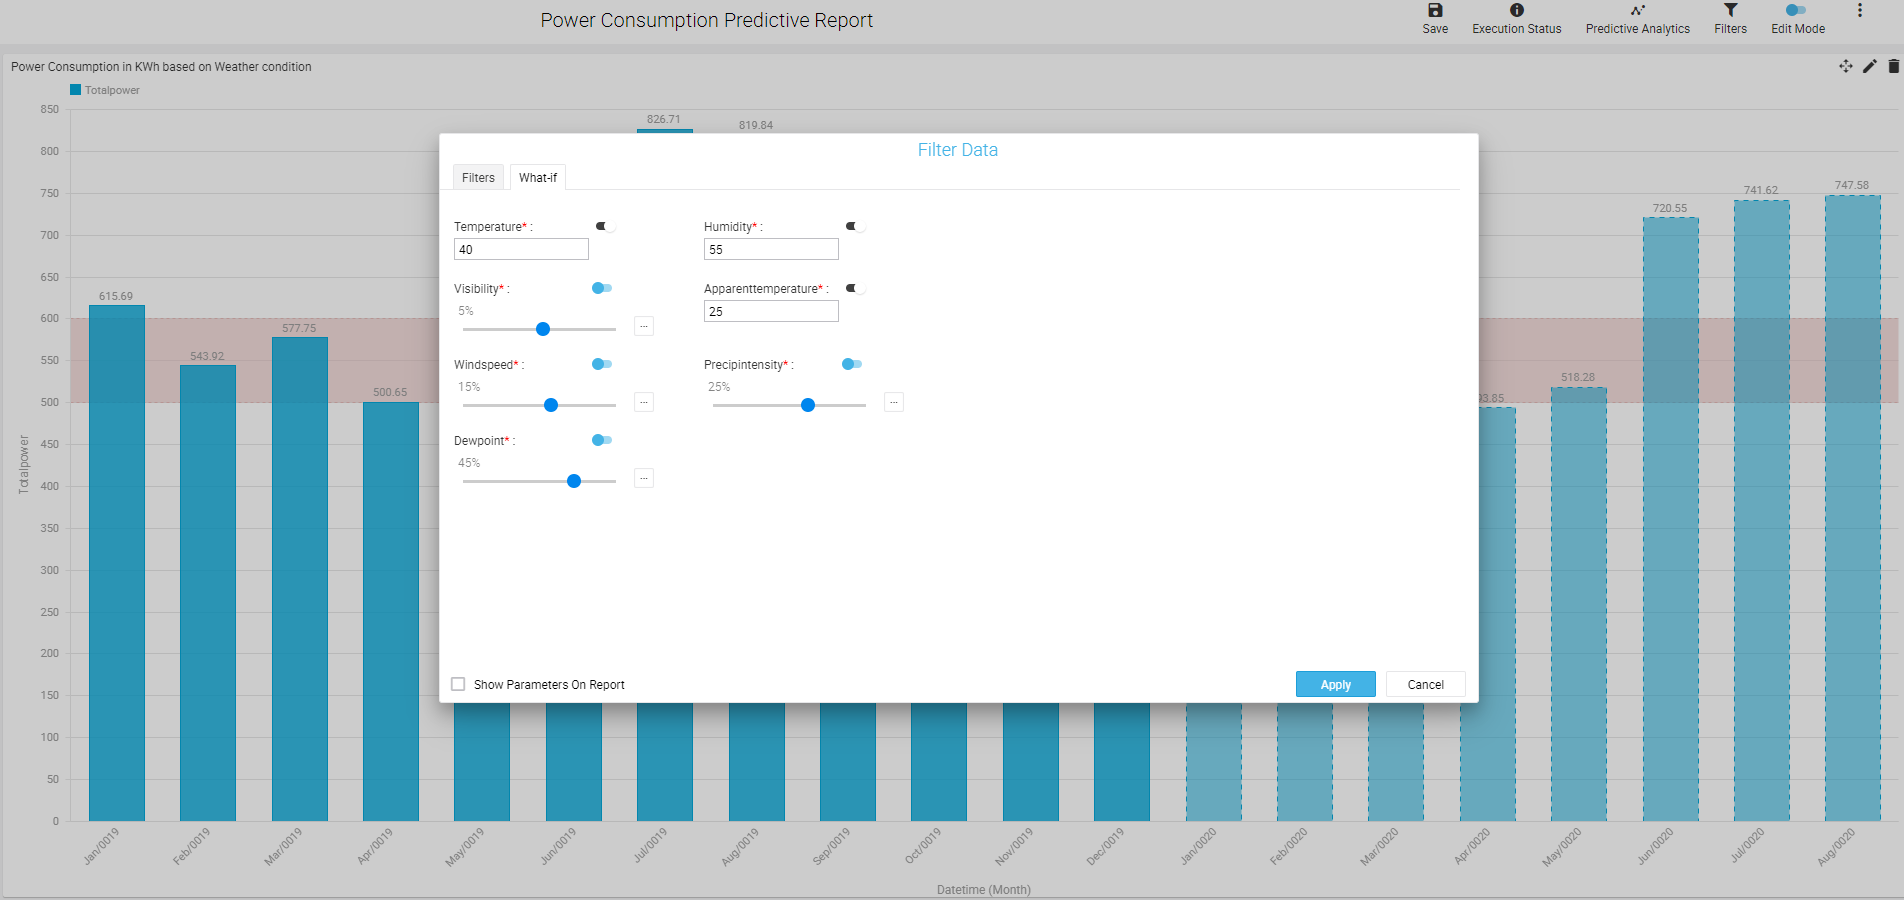
Intellicus 19.0 now lets you specify absolute values for independent variables and see their effects on the dependent variable in what-if analysis. For example, to predict total power consumption of a cooling tower in a Data Center based on various environmental conditions, you can specify exact positive values of current temperature, humidity etc.
You can choose to toggle between slider (percent values) and absolute value for numerical independent variables.
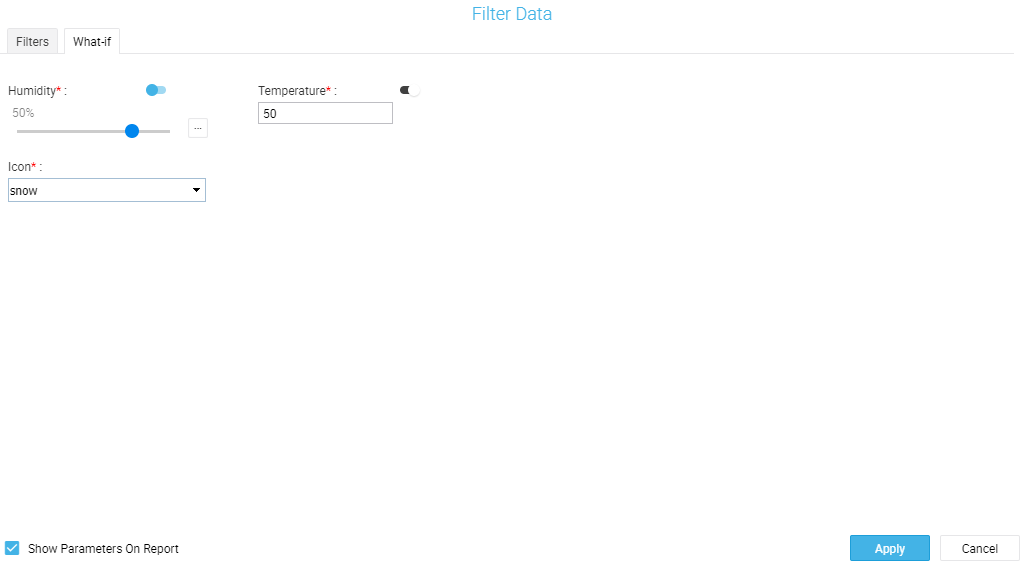
You can now perform What if analysis on independent variables that belong to a category of values (like gender can be Male (M) or Female (F), product type as electronics, apparels, food etc.) and see their effects on the dependent variable (say Total Population, Sales Achieved etc.)
You need to write the Prediction Script accordingly to encode the categorical features to numeric quantities.
The values of categorical variables are populated in the 'What if' pane in form of grouped radio control or drop down based on quantum of distinct values for that variable.
For instance, if you want to know how much power will be consumed at a certain temperature, you can adjust the temperature value accordingly to get the prediction. This will help you to take planned future actions and make operational decisions based on the predictions you derive.
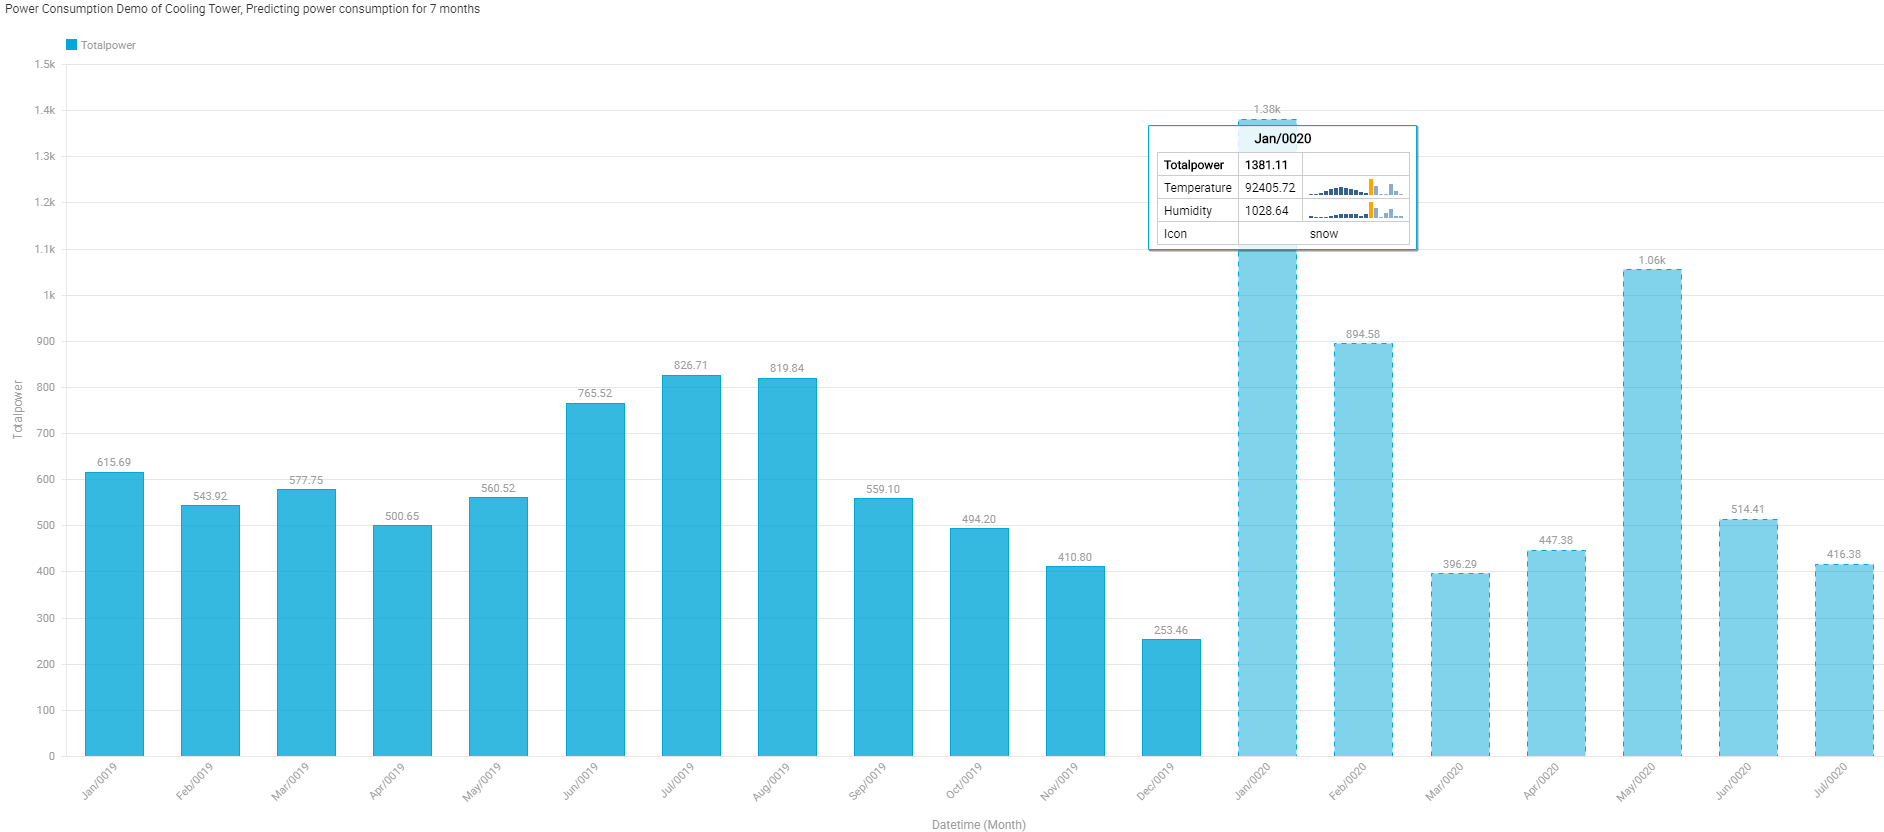
An example of predictions achieved with the above use-case is shown below:
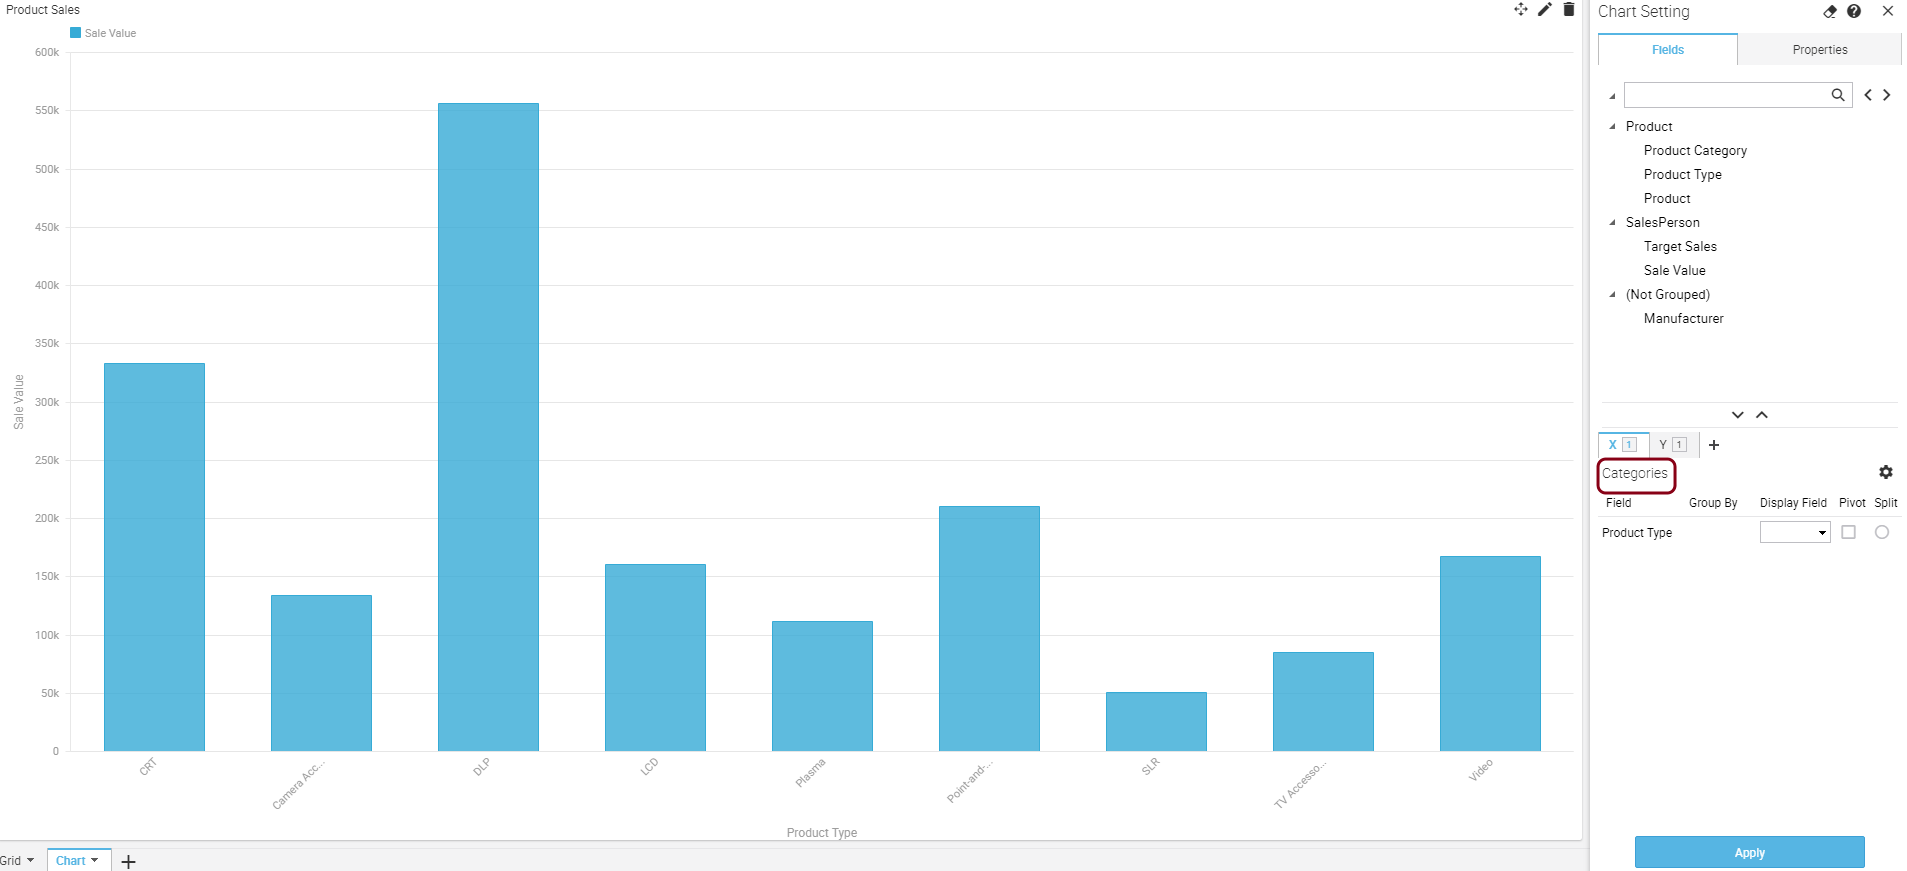
Intellicus 19 lets you specify the maximum number of characters (Max Characters) to view for chart X-axis labels. If there are more than specified characters, the label names will show maximum number of characters followed by an ellipsis.
You can alternately specify the percentage of screen space to be utilized by X-axis labels using Max Height value.
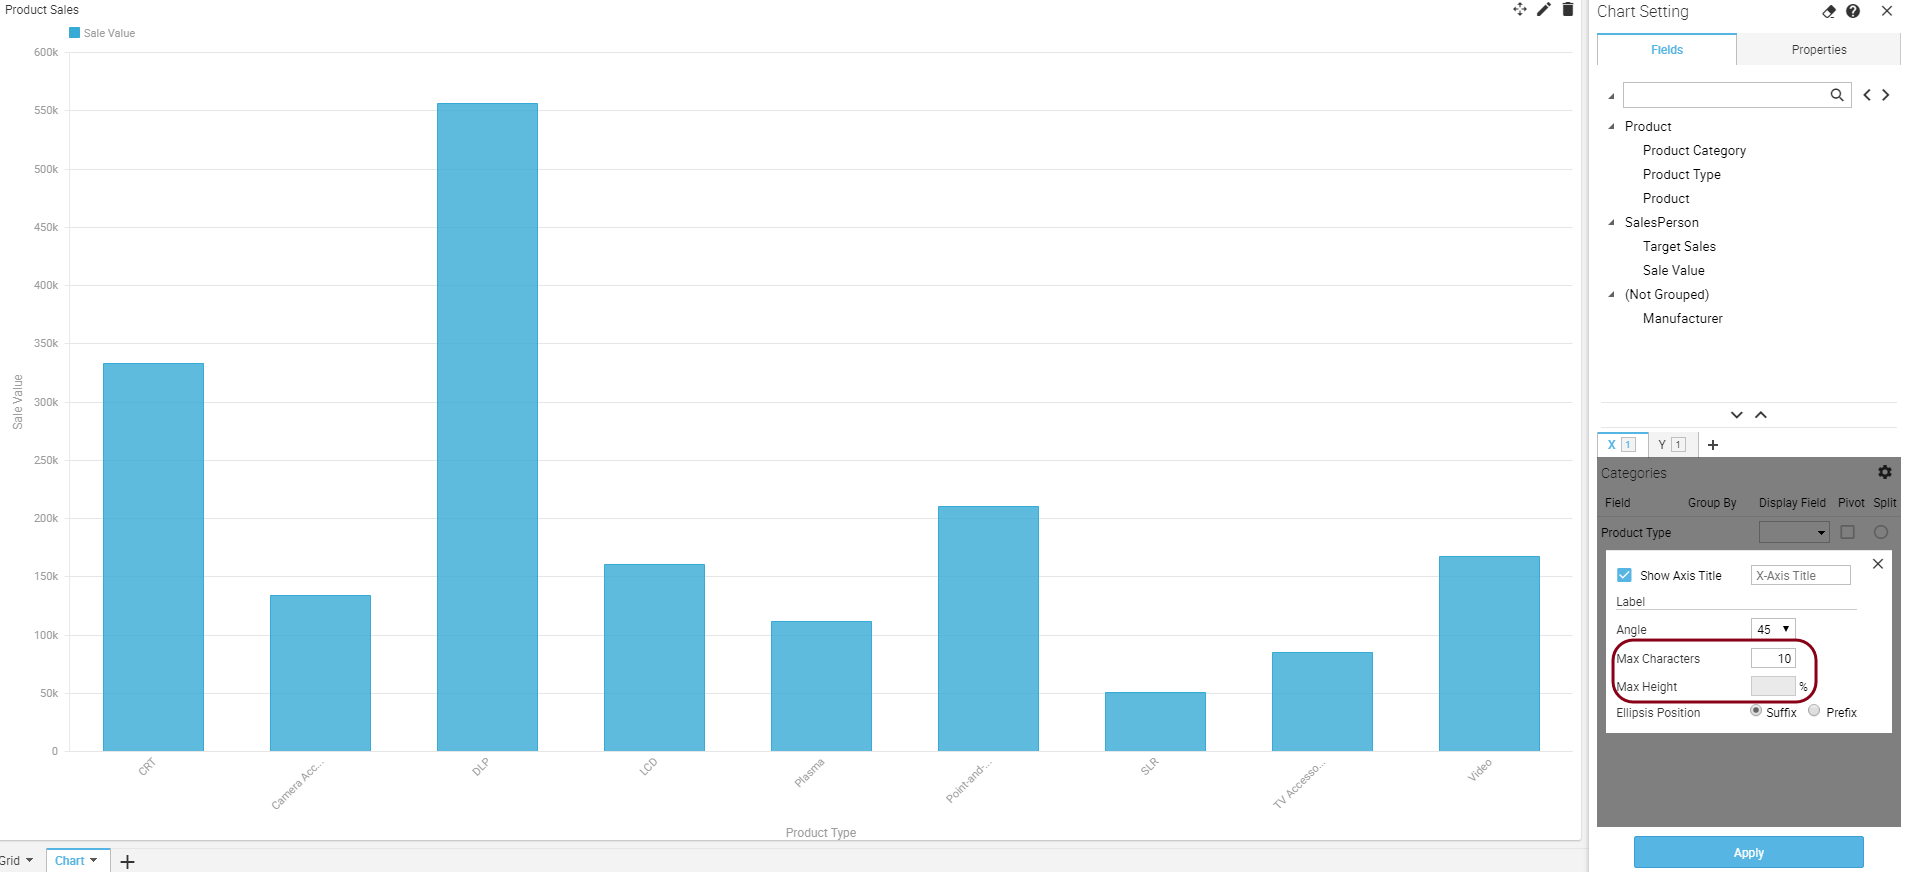
Intellicus 19 has changed the captions of panes where data fields are dropped for X and Y axes.
To maintain generic captions for different chart types, you can now view X axis caption as 'Categories' and Y axis caption as 'Series'.