|
|
|
|
A semi-additive measure can be aggregated along some, but not all, dimensions that are included in the measure group containing the measure. For example, Opening Balance and Closing Balance can be more efficiently calculated using semi-additive measures.
Intellicus 19 introduces feature for semi-additive measures by providing First Child and Last Child measures aggregation. Opening balance will be first child measure and Closing balance will be last child measure.
Semi-additive aggregation is useful when you have a fact table that contains snapshot data.
For example, if you have a fact table containing information on the number of items in stock in a warehouse, then it would not make sense to aggregate these measures over time: if you had ten widgets in stock on January 1, eleven in stock on January 2, eight on January 3 and so on, the value you would want to display for the whole of January would never be the sum of the number of items in stock on each day in January. The value you require depends on your organization's business needs.
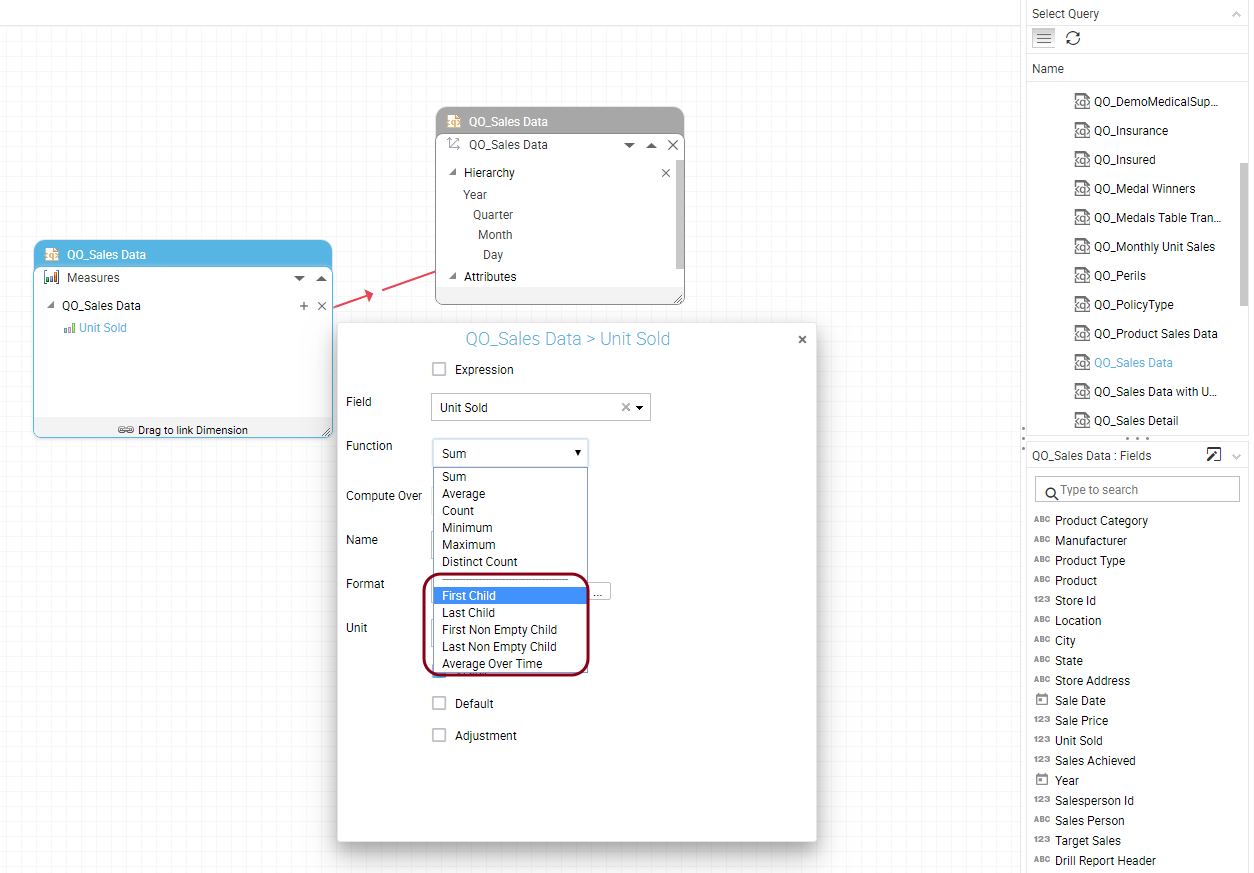
For each measure, you can select from the types of semi-additive functionality described in the following table.
| Semi-additive function | Description |
| First Child | The member value is evaluated as the value of its first child along the time dimension. |
| Last Child | The member value is evaluated as the value of its last child along the time dimension. |
| First Non-Empty Child | The member value is evaluated as the value of its first child along the time dimension that contains data. |
| Last Non-Empty Child | The member value is evaluated as the value of its last child along the time dimension that contains data. |
| Average Over Time | The aggregation of a member is the average of its children. For example, if you have two dimensions Time & Location and one measure; then the measure value will be shown as average of its children.
But if you remove Time dimension, the measure value will be shown as sum of its children. |
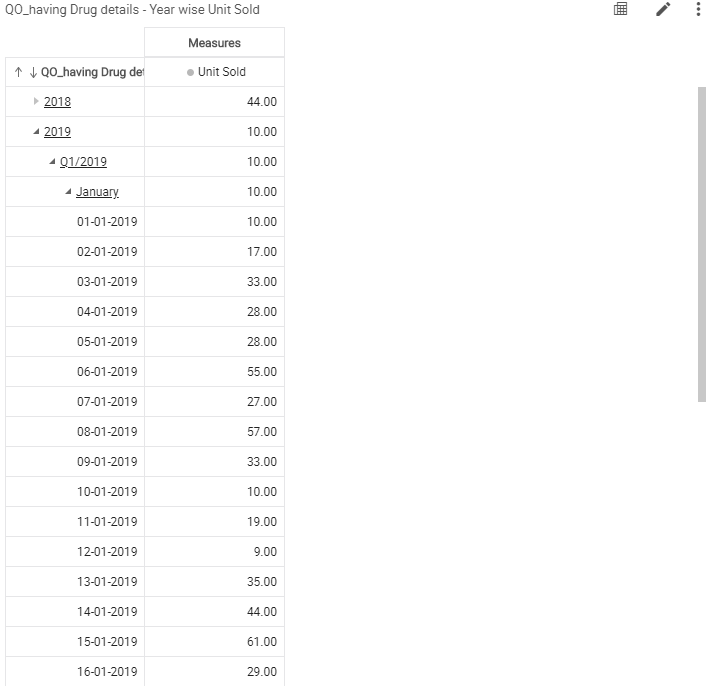
Below is a sample report output using 'First Child' semi-additive function to aggregate 'Unit Sold' measure.
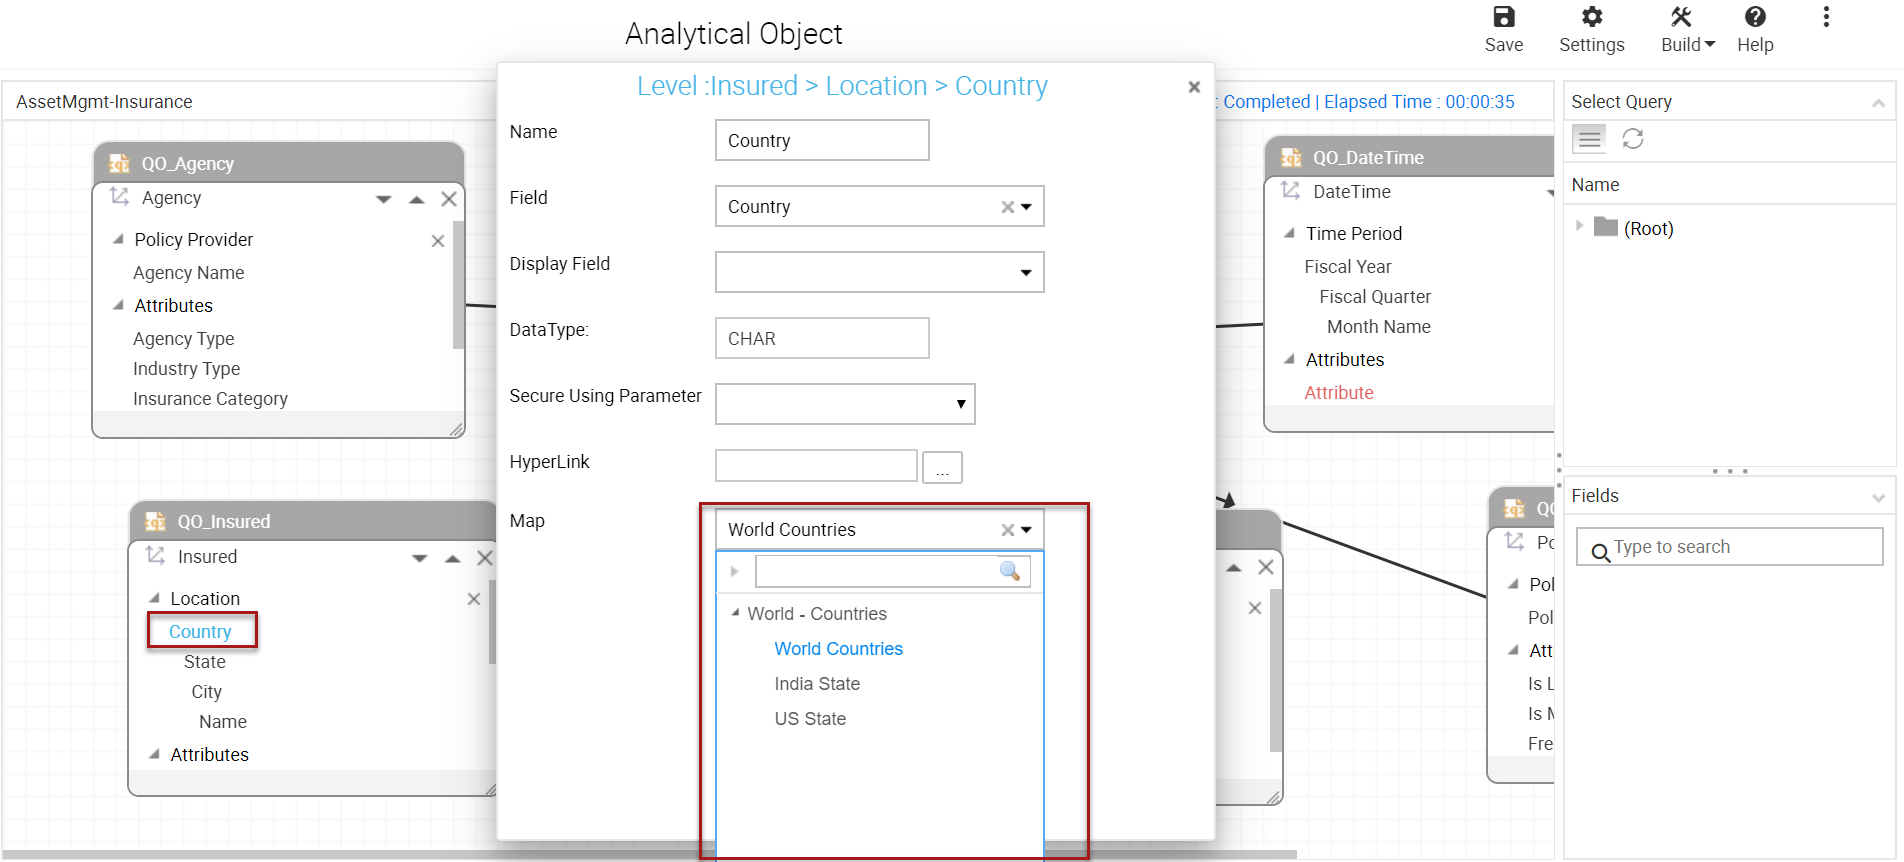
In Intellicus, you can now create advanced geographical maps in HSV reports. This helps you to view your data on real world maps and get a clearer understanding of location-based insights.
To create GIS maps, you need to first make the location dimension GIS enabled while creating analytical object. Then you need to map the location with their respective type, that is if dimension is country you need to map it with country of your choice.
The following screenshots show an analytical object where we have made the location dimension GIS enabled and mapped the country dimension with the required location respectively.

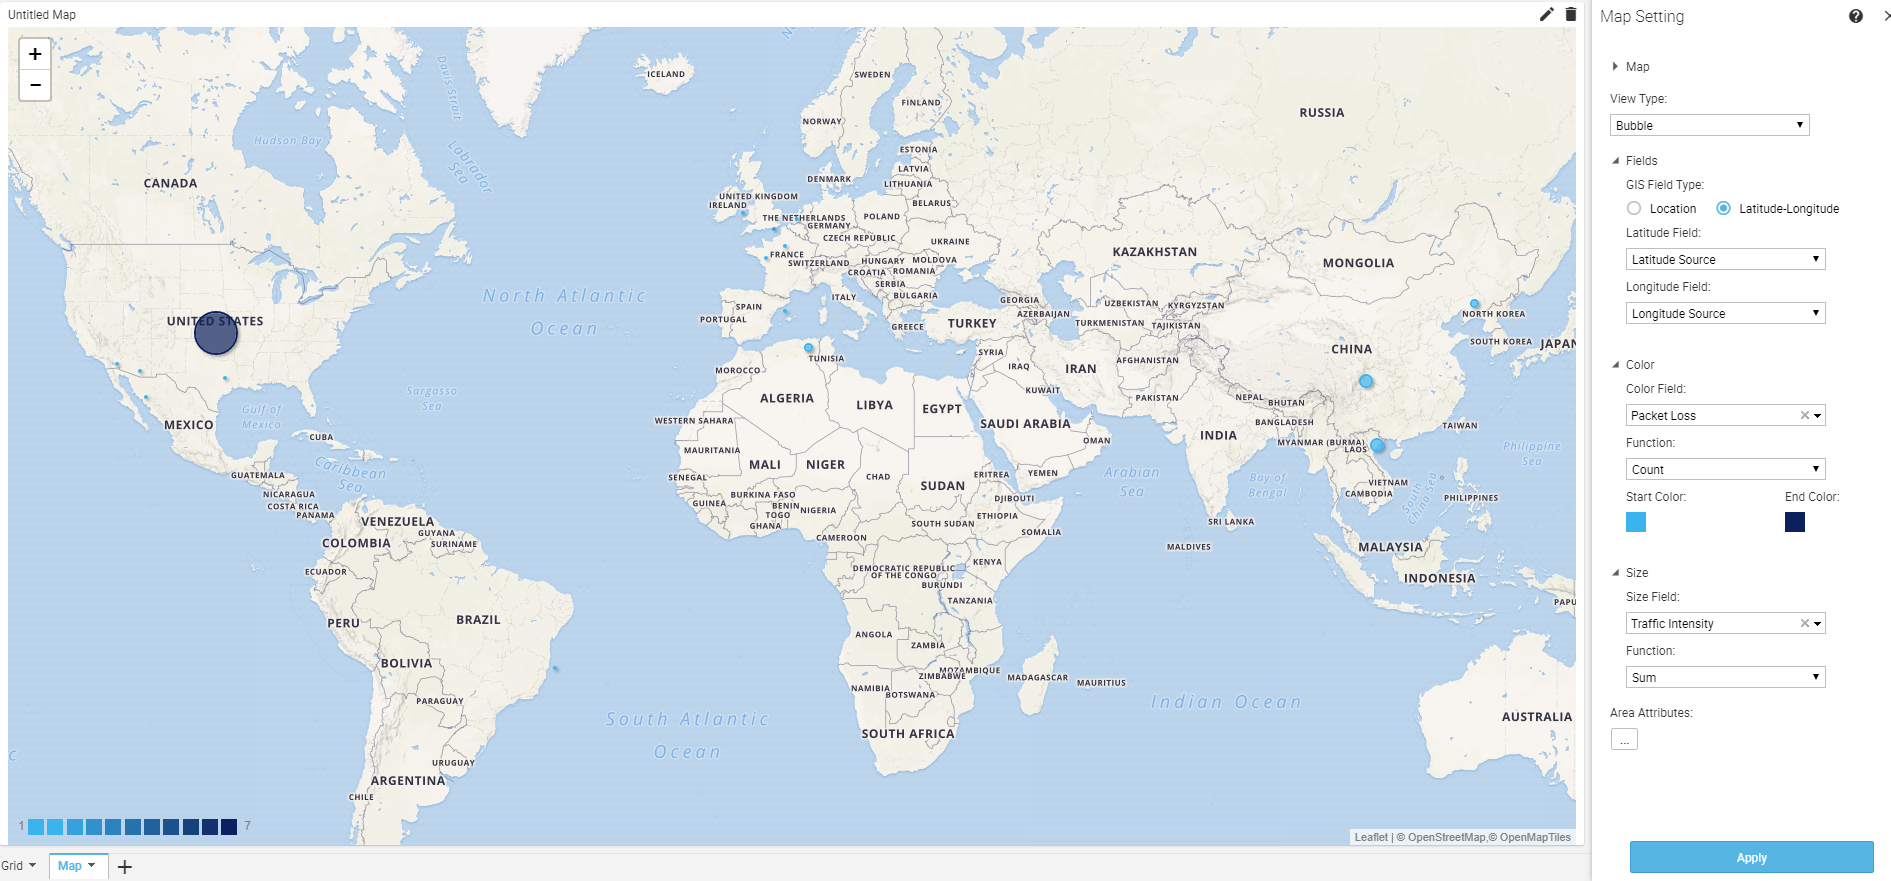
Let us now see the resultant report. To create the GIS map, open your HSV report, change the cross tab to map view under "Change View Type". GIS Maps will display data in the form of bubbles of the first selected measure.
You can also view values of various measures as tool tip.
Under Map Properties, you can choose a Map Layer as "Standard" or "Satellite" to display your specific GIS dataset. Also, the Marker Color on the map can be specified.
In this report you can visualize the country-wise total insurance value for various policy types.
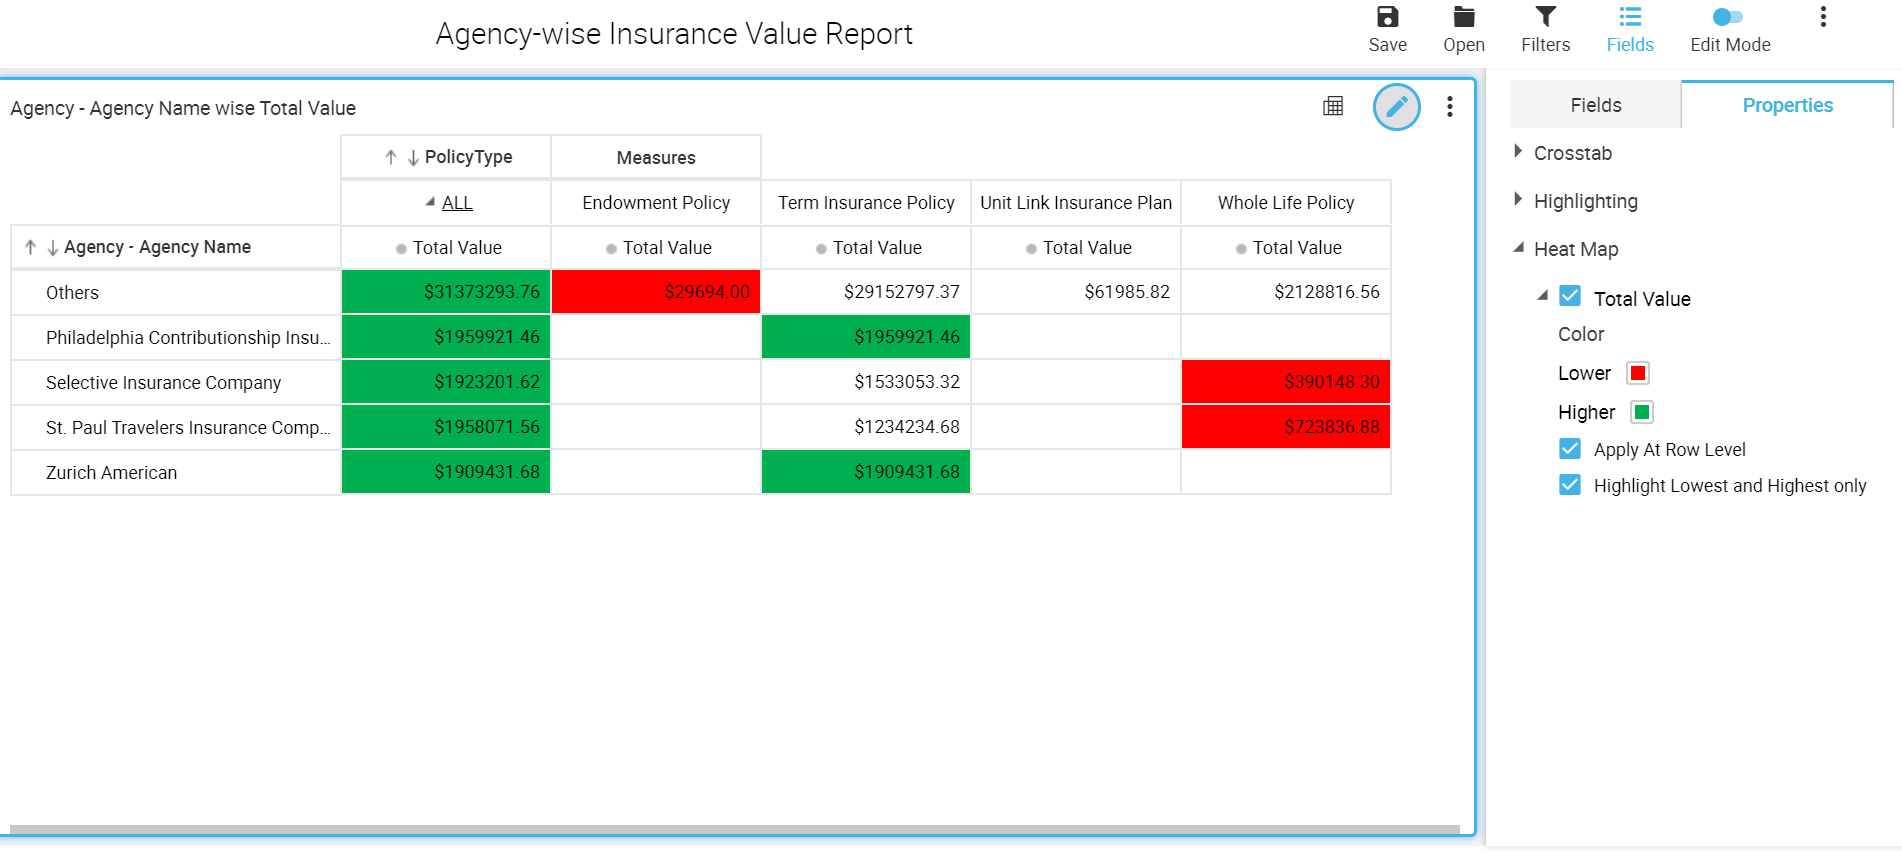
With this feature, you can create a gradient based distinction between higher to lower values. You can create heat maps on column as well as on row level. You can also choose to highlight only highest and the lowest values.
Let us take an example, we have created a report to show Agency-wise total insurance value and measured these values based on policy types. We have created a heat map to highlight the highest and the lowest value column and row wise.
With this representation, we can clearly see the highest and lowest collection done by various agencies in selling different policies. Based on such insights the agencies can formulate a plan to do a better sale in the future.
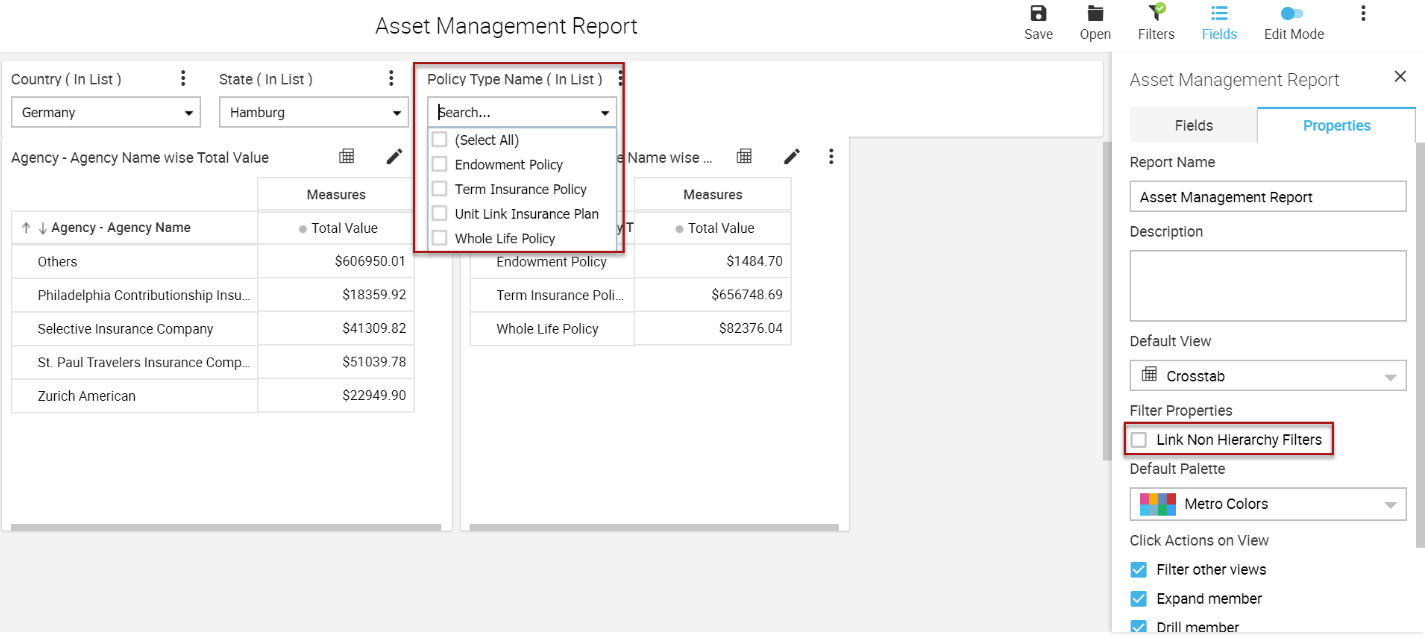
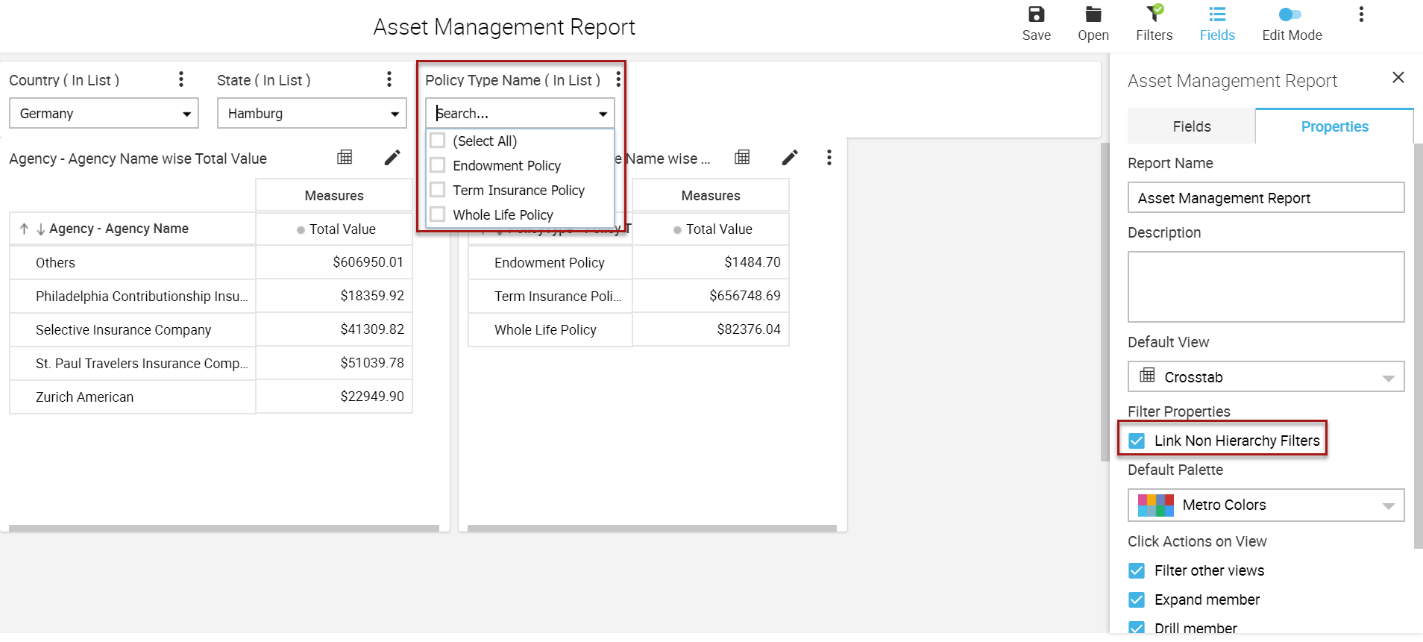
Intellicus supports non-hierarchical filtering in HSV reports. Earlier, you could filter hierarchically, which means if you chose country as a filter criterion, the state filter would update to show states belonging to that country.
However, if one of your filter criteria was say Policy Type, and it did not fell under Region hierarchy, it would list name of all types of policies. Now with non-hierarchical filtering, the policy type filter will update to display the names belonging to the choices you make in the country and the state filters.
This will help you to bring out even relevant data in your HSV views.
The following screen shots show how the filters would appear without or with linking respectively. You will observe in both the examples country and state are same.