Geographical Information System (GIS)
Once you have the geographic fields and assigned roles corresponding to them on the Query Object screen, you can then render maps in Intellicus.
Intellicus supports online map providers to render geospatial data, with online layers/tiles.
Intellicus supports the following map types in Smart reports:
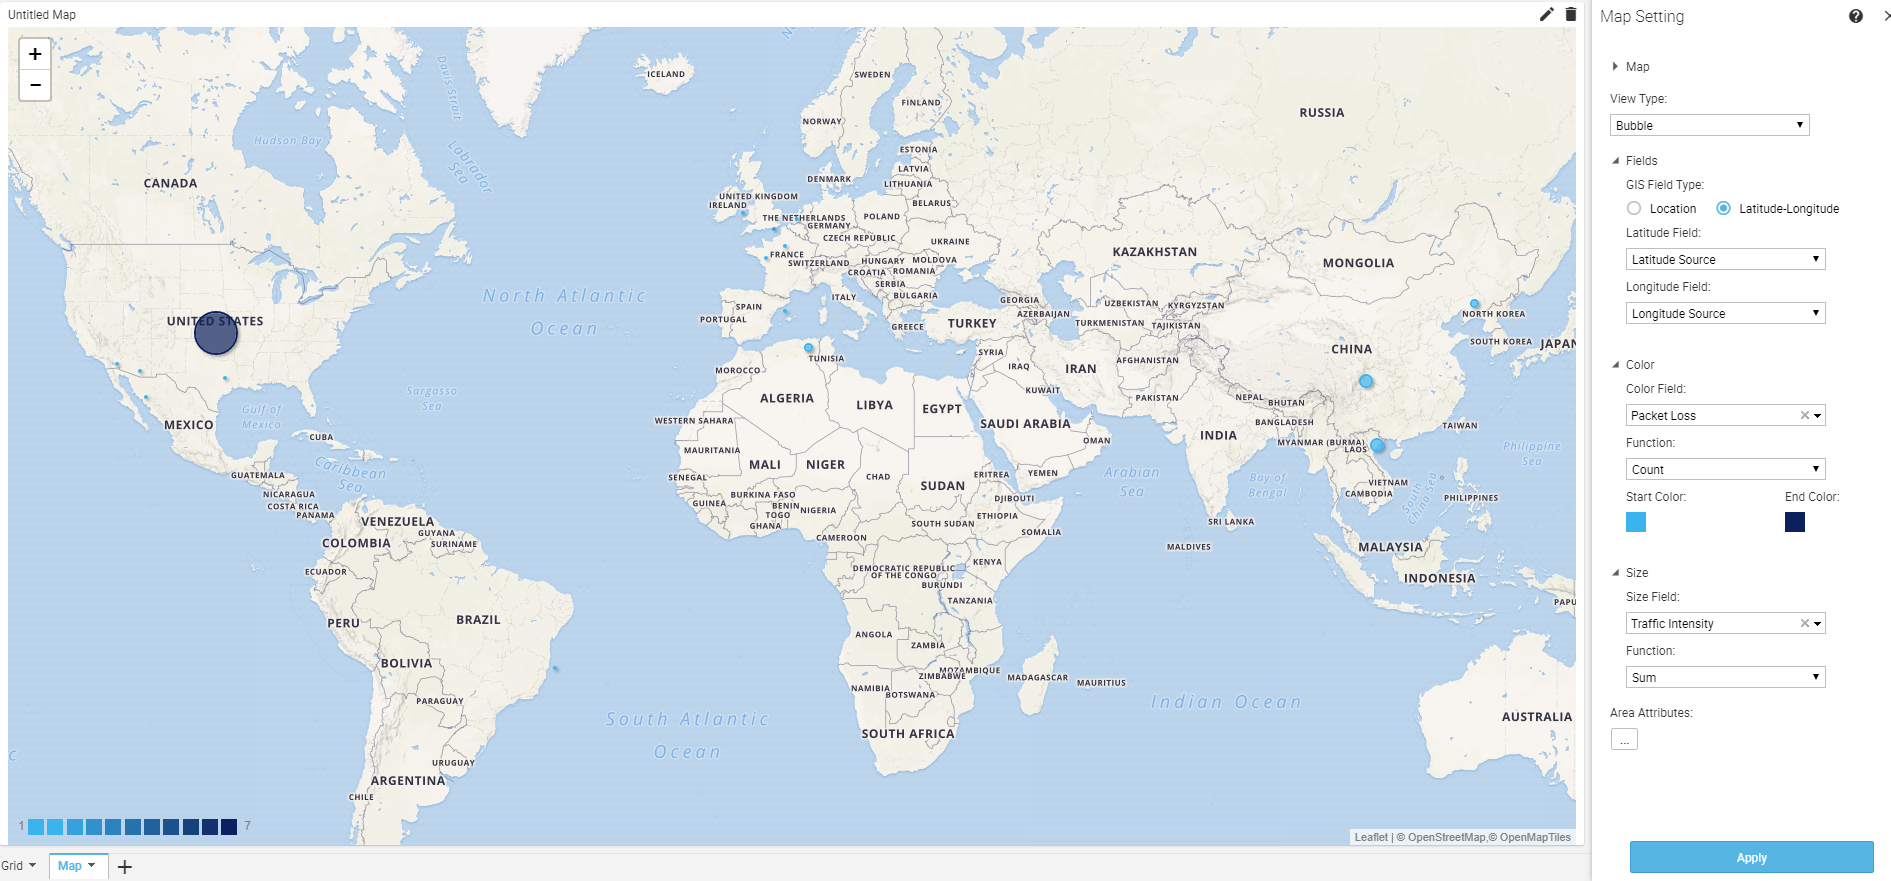
- Bubble Map: To show bubbles on geographic locations and perform business analysis based on color and size measures. The bubble size will be governed by the data value they represent.
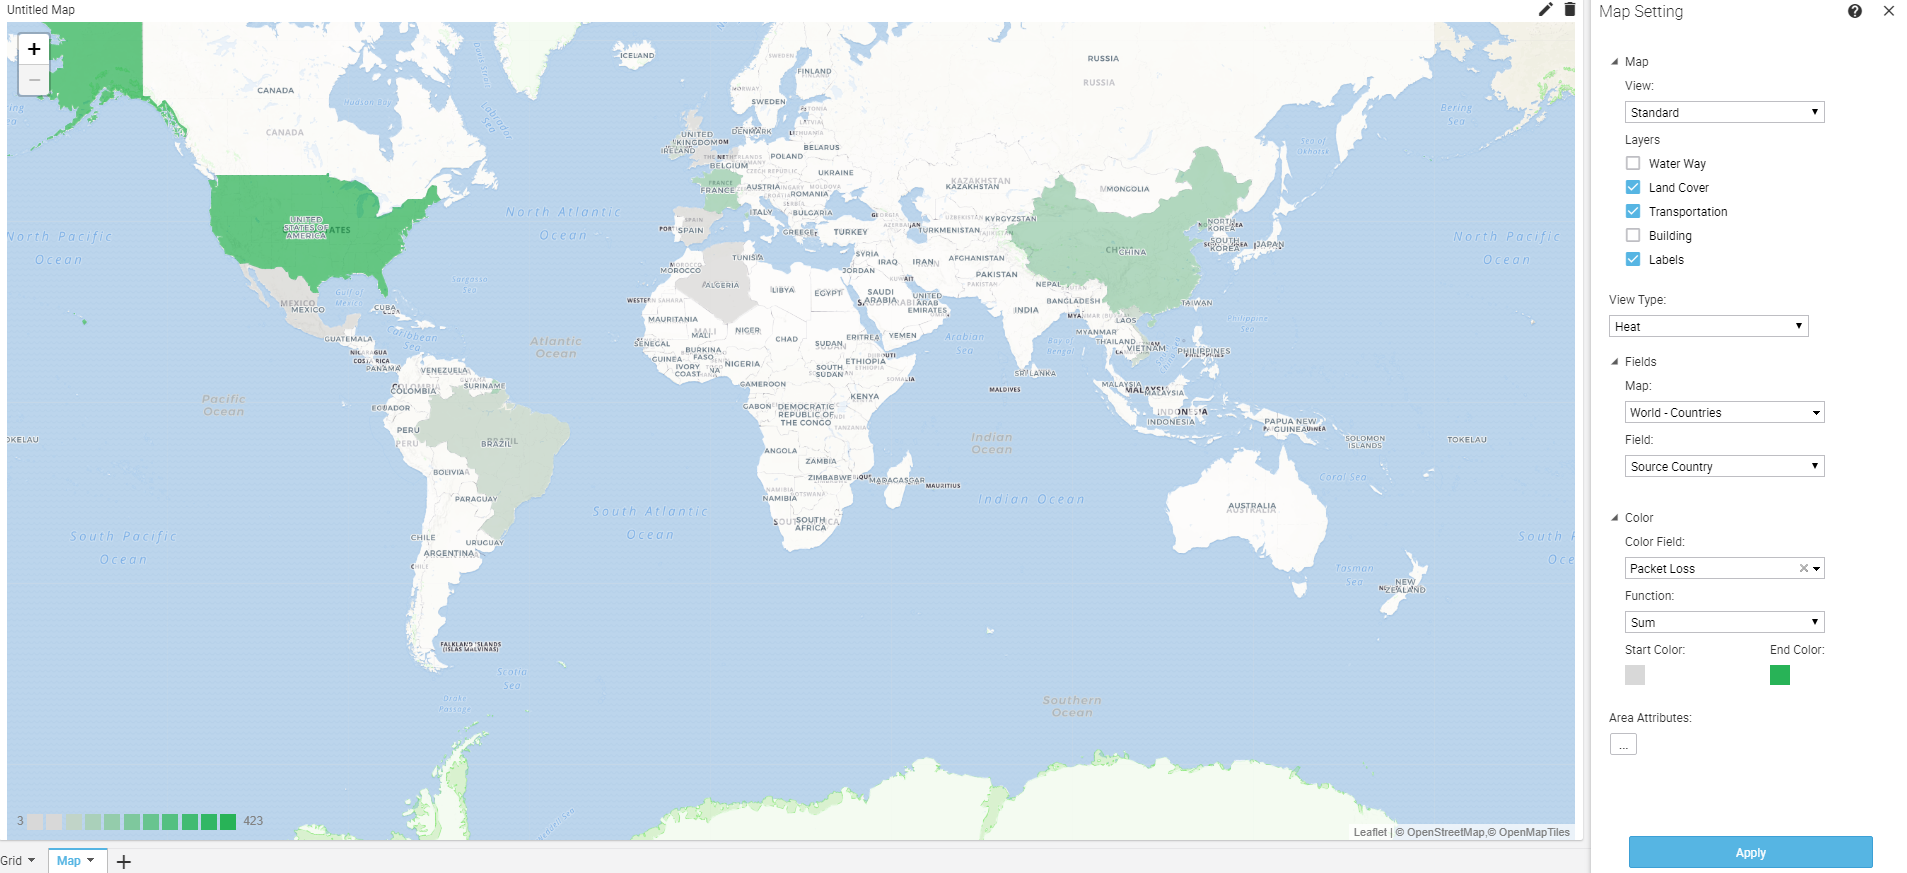
- Heat Map: To show heat/choropleth map on areas and perform business analysis based on color measure. The color gradient is used to represent different values like the highest value will be darkest and the lowest value will be lightest.
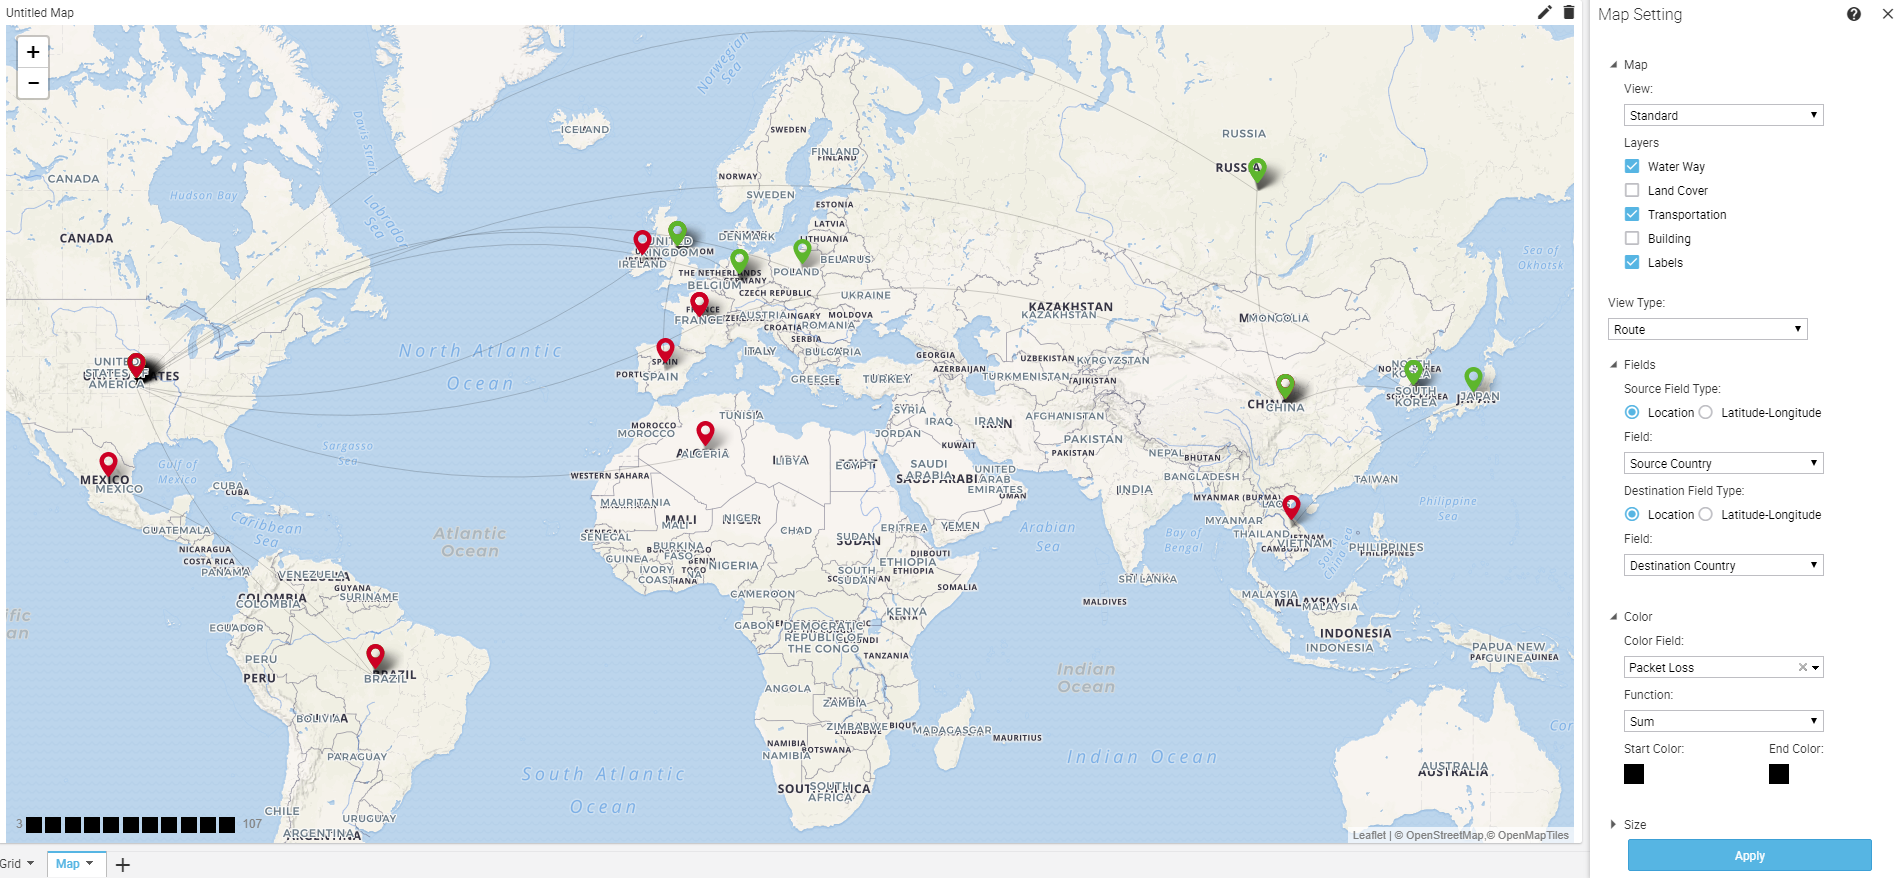
- Route Map: To show routes between different geographic locations and perform business analysis based on color and size measures i.e. color and thickness of arcs/routes/curves.