|
|
|
|
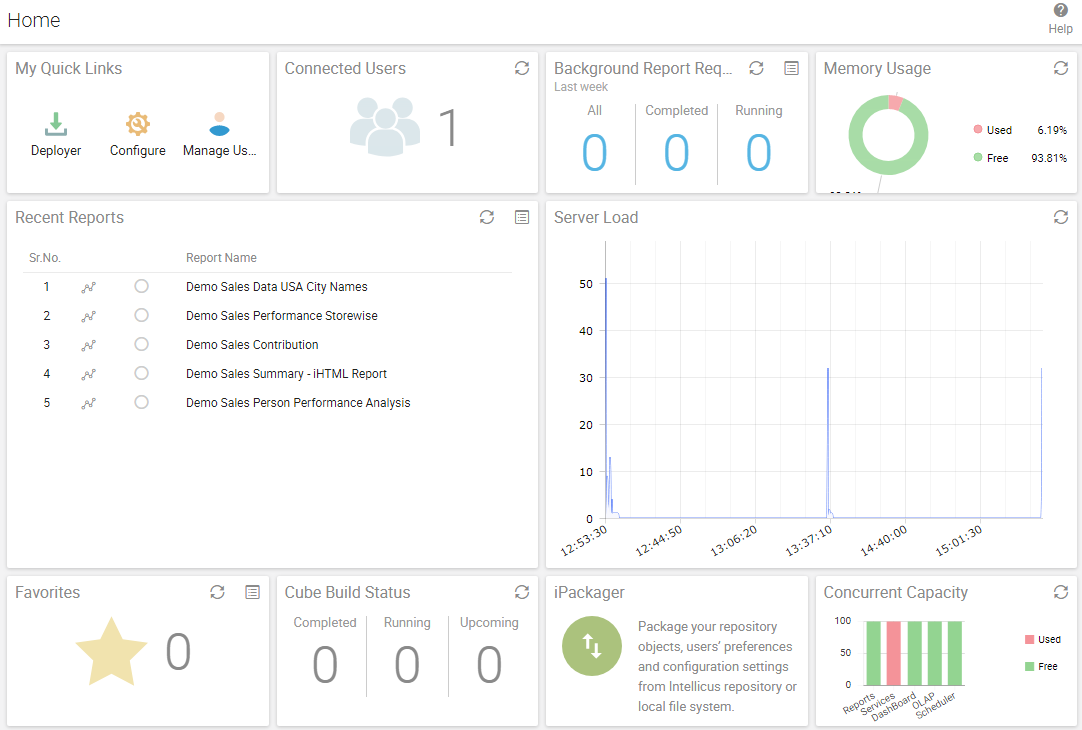
Intellicus 18.1 home page is now redesigned to offer an easy-to-use interface that enables self-serve, intuitive analysis on recently used reports.
With a single click, you can choose to navigate through quick links, see the list of background report requests and recently ran reports, memory and server load usage, cube build status, launch iPackager and many more activities.
Intellicus' new Smart View Designer enables end users to perform analytical operations on the report on-the-fly.
The sophisticated visualizations will lead to self-reliant analysis of data.
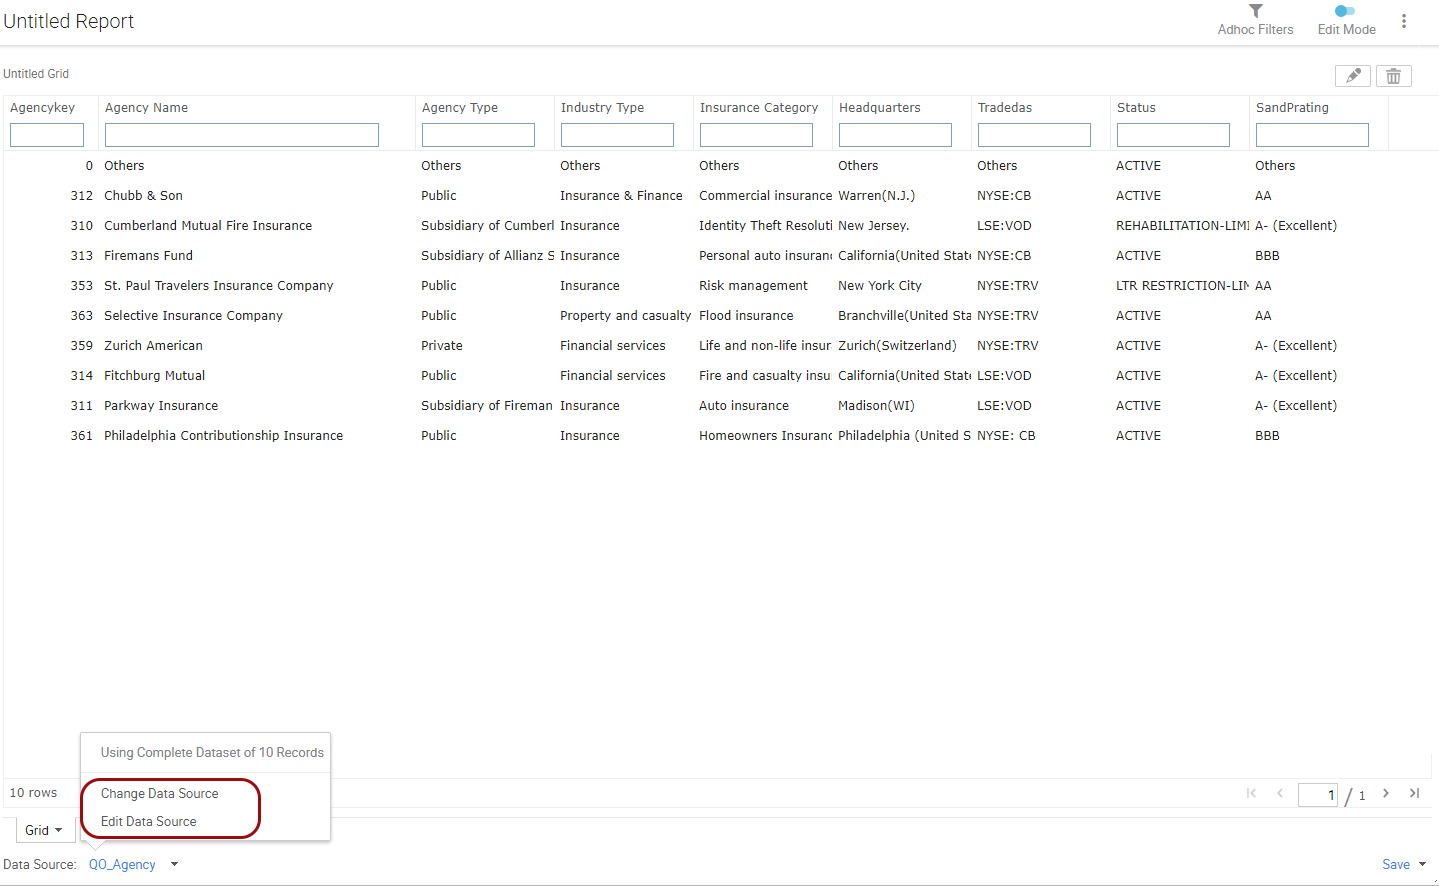
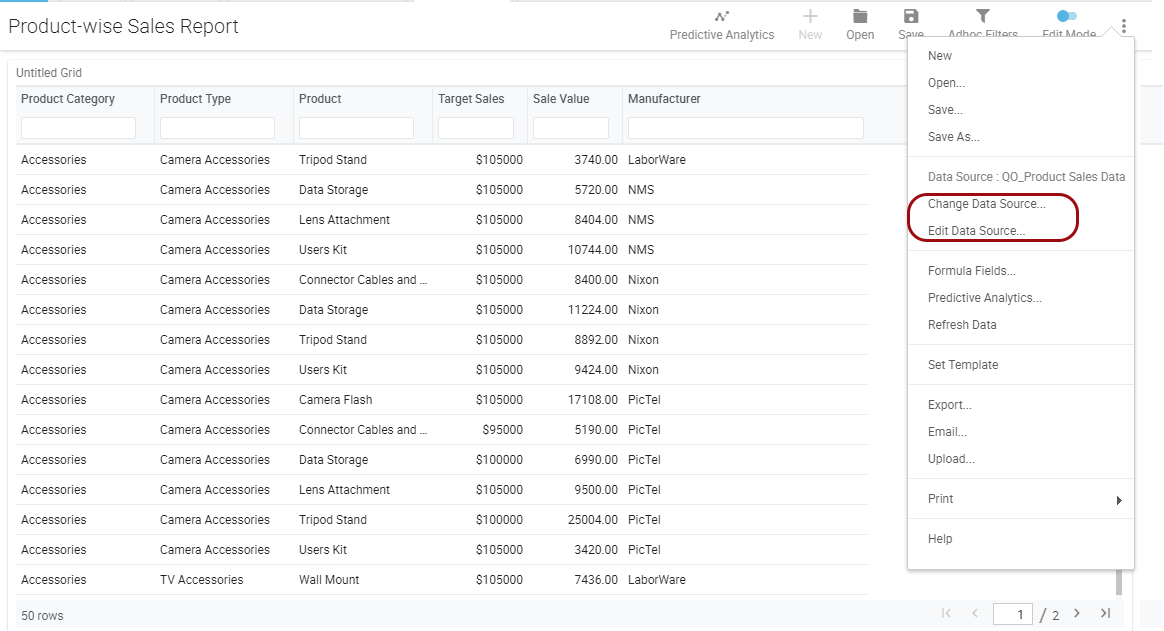
To get better rendition space for your reports, options like Change Data Source, Edit Data Source have been moved from the bottom to the main menu of the report as shown in the images below.
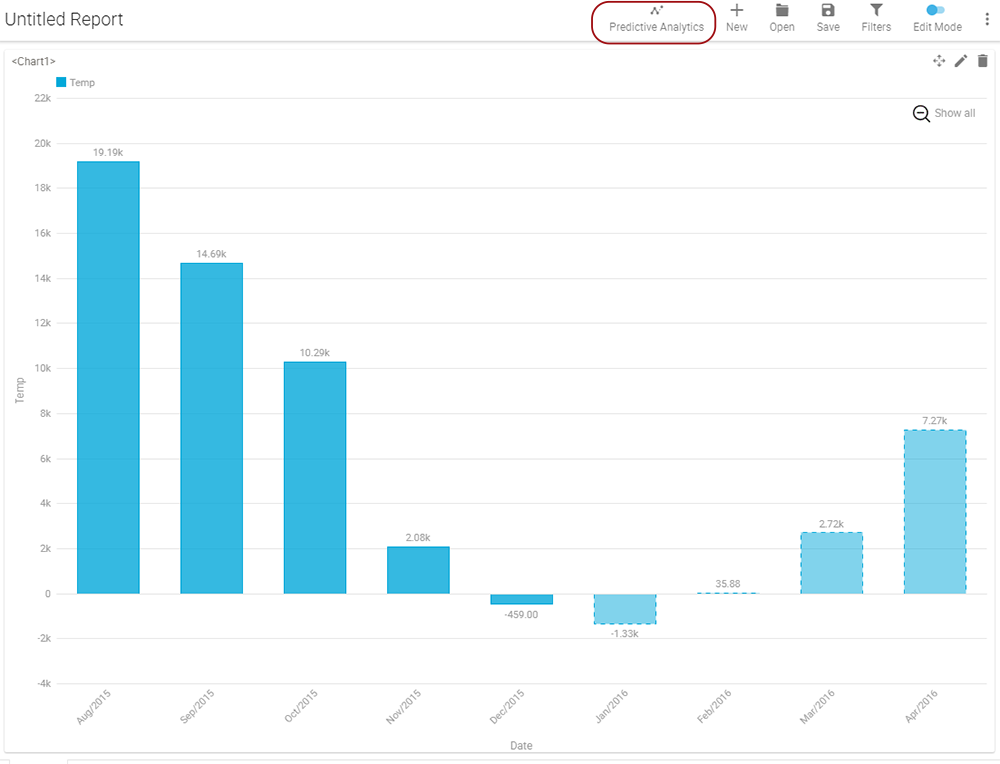
With Intellicus, business users can perform predictive analytics to get predictions on their data. To see the Predictive Analytics button in Smart View, it is mandatory to have a valid connection to R Data Science Engine.
You can use filters to limit the data that appears in the Smart report. You can narrow down the report data based on business conditions.
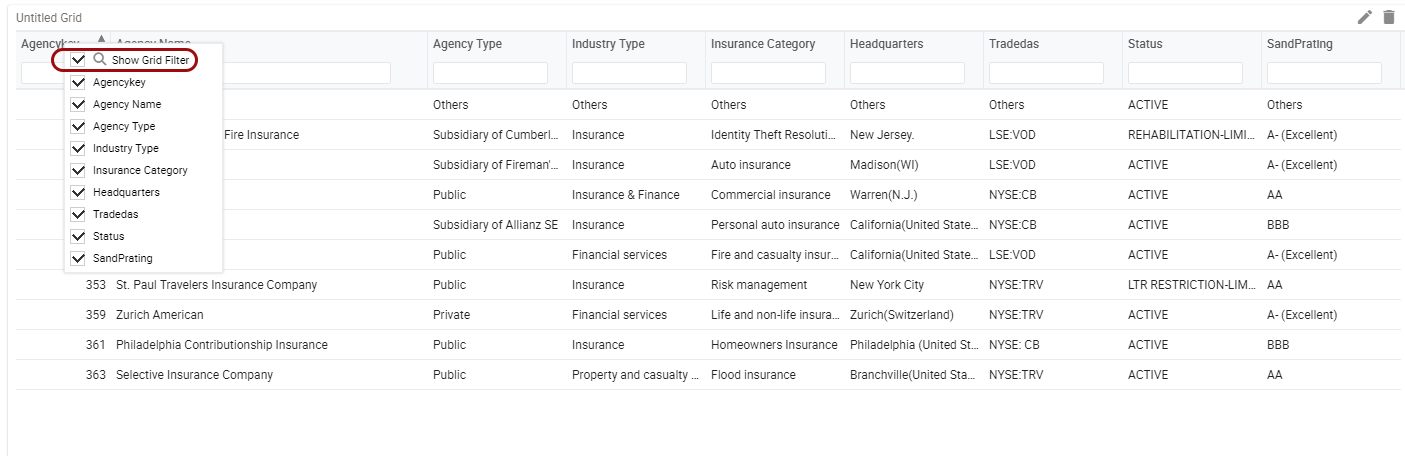
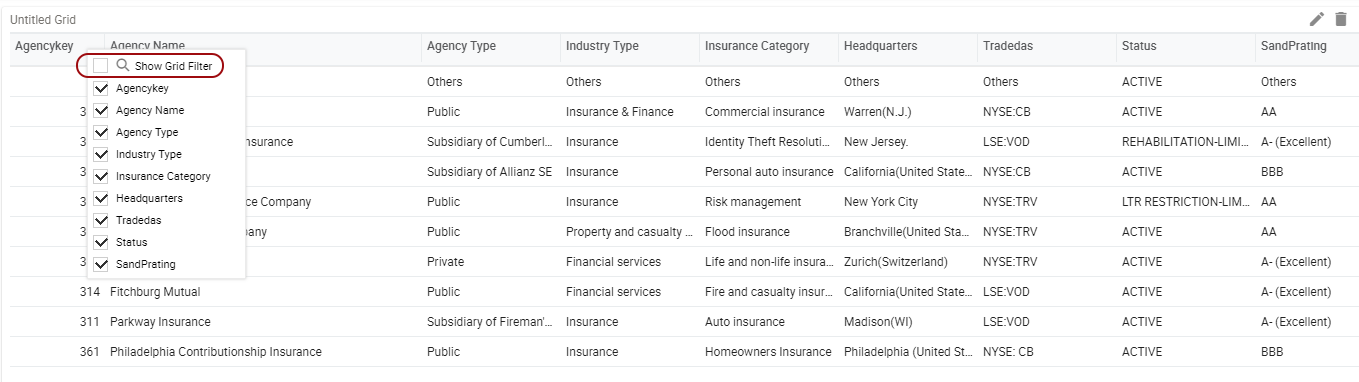
Intellicus 18.1 helps you show/hide the grid filter (on right-clicking the column header) to enable/disable searching specific data in the grid. Unchecking the 'Show Grid Filter' would hide the search boxes and save the space for better report rendition.
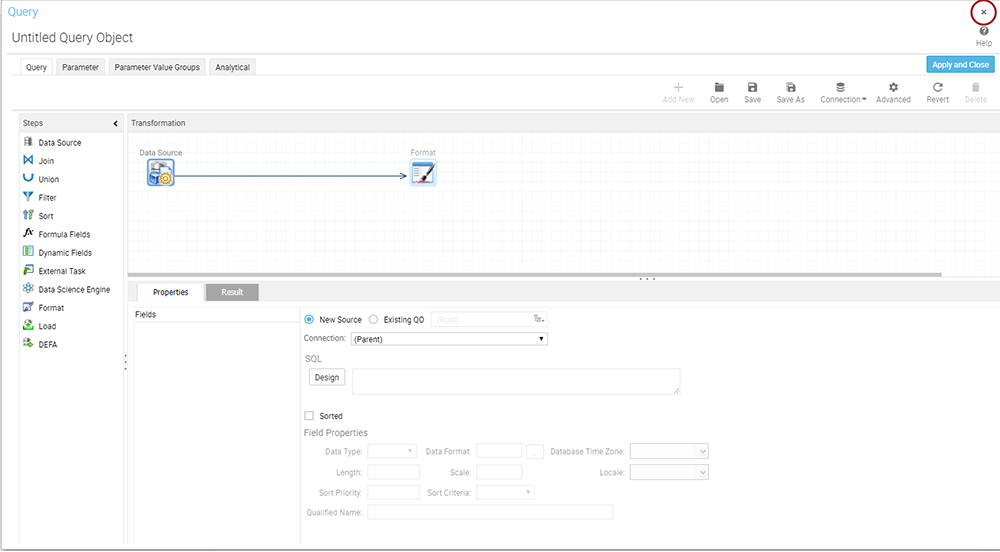
To maintain uniformity across the portal, the 'Close' button is replaced with a 'X' button on top right corner of every window.
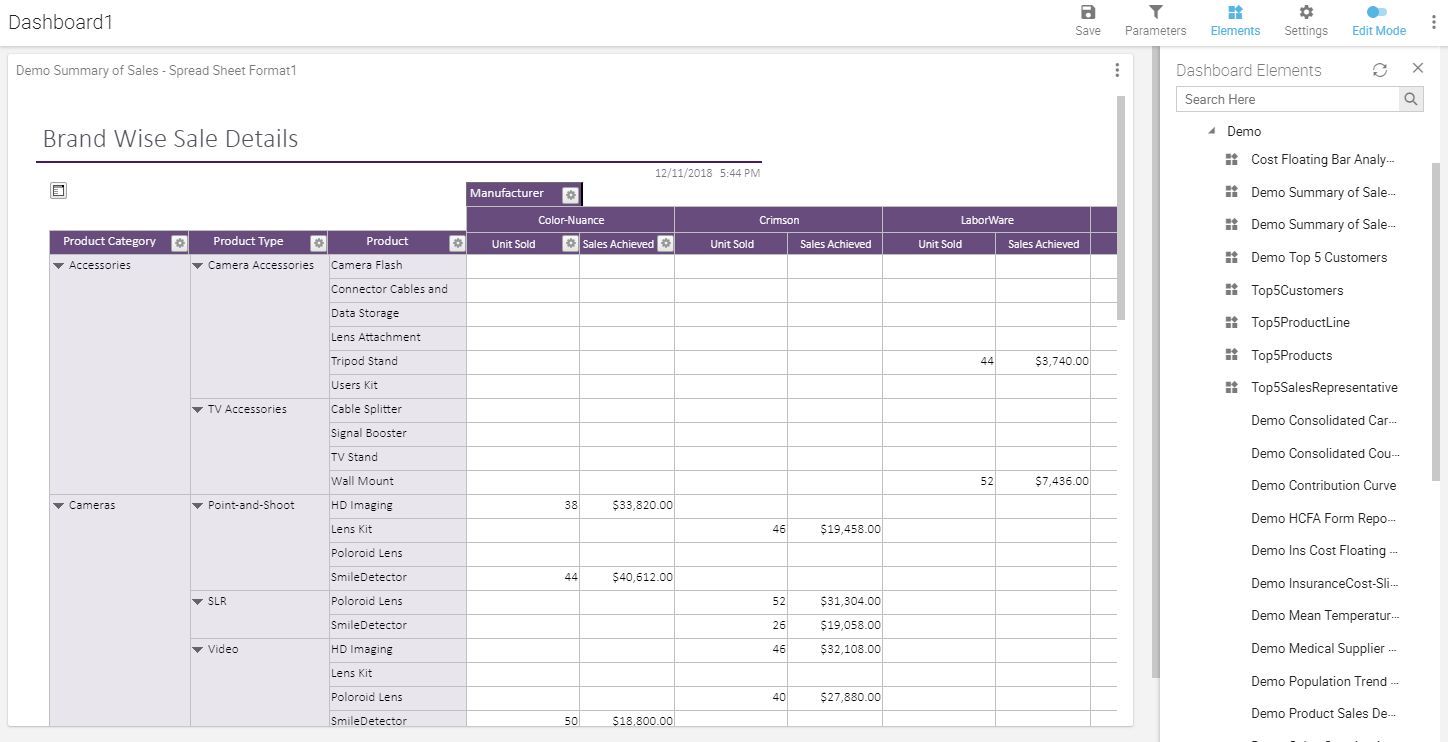
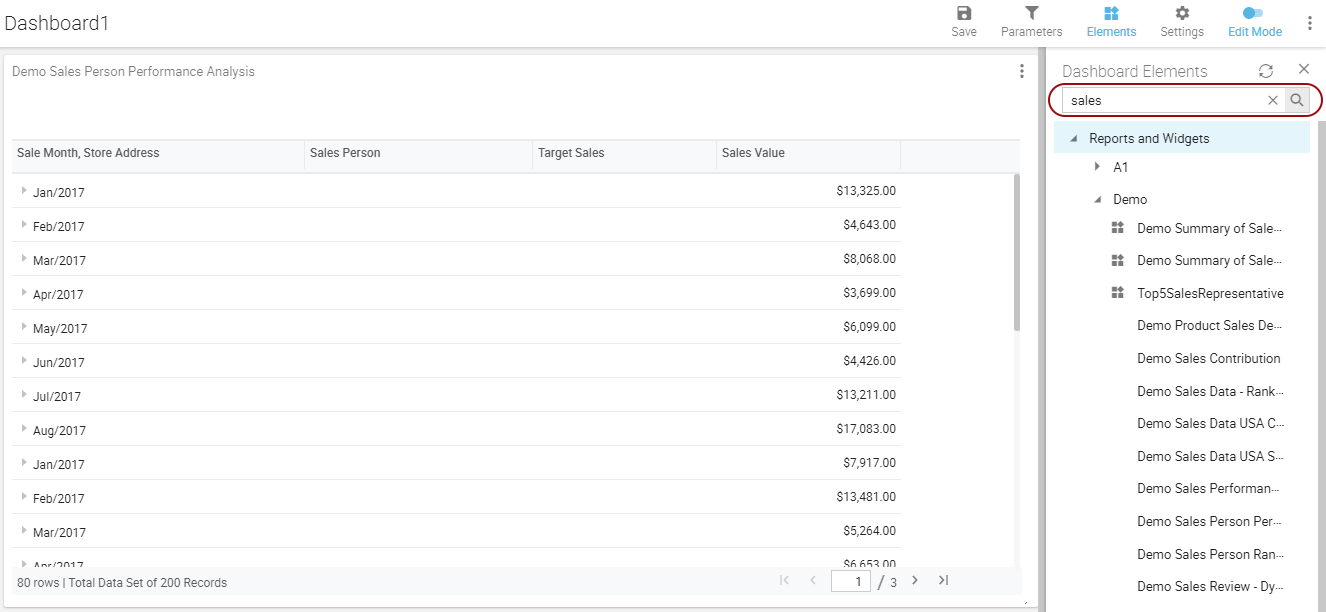
You can now search specific reports or widgets if the list of Dashboard Elements is too long to navigate.
With Intellicus 18.1, all reports would be rendered in HTML format on the dashboard even when the report is in PDF, WORD or any export format.