|
|
|
|
With the implementation of this feature, you have the ability to use your own customized SVG images to be rendered as a chart type. You need to place the custom SVG file containing the visualization rendering information, data representation including animation etc. under
Intellicus chart control supplies data and activates the SVG to render.
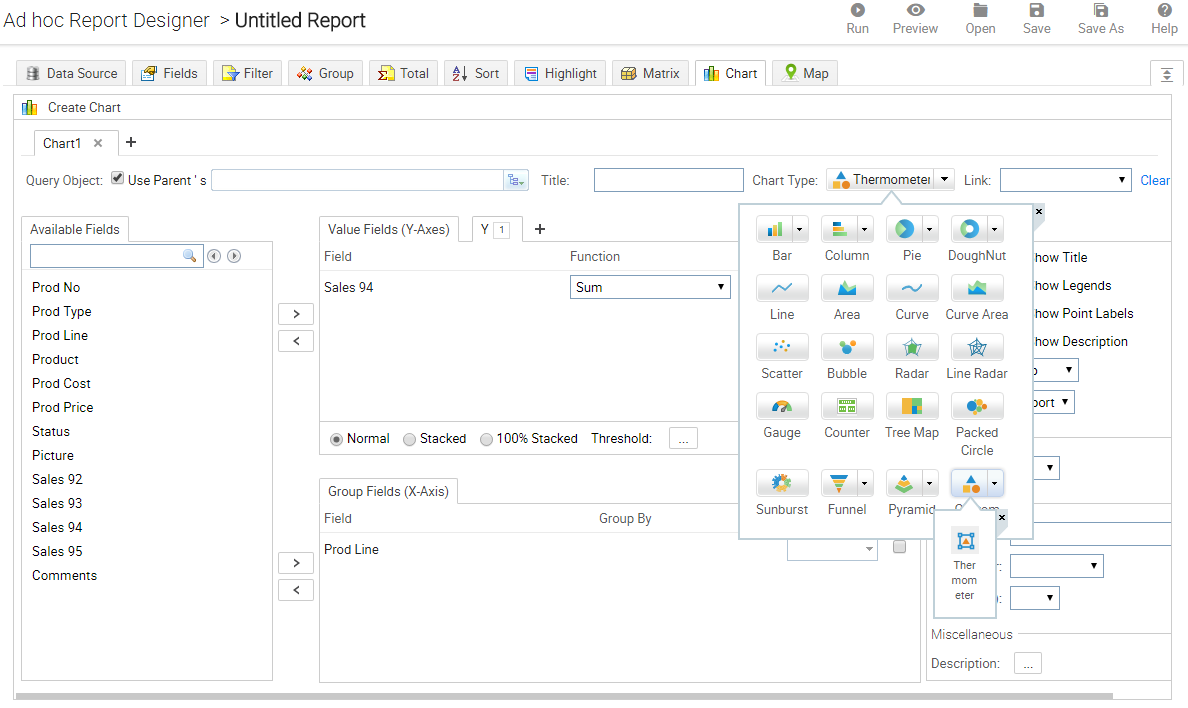
The added custom SVG would appear under the Chart Type as shown below.
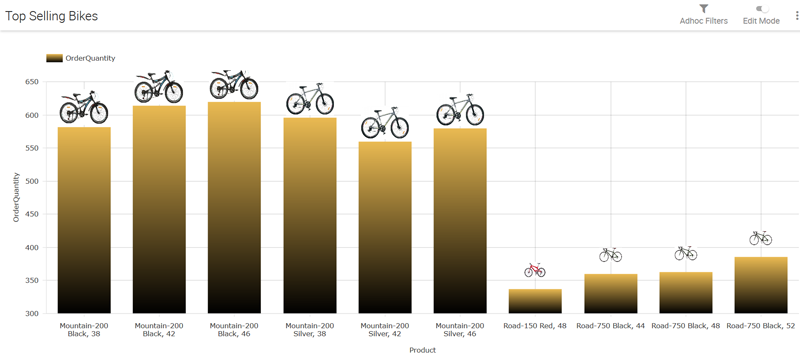
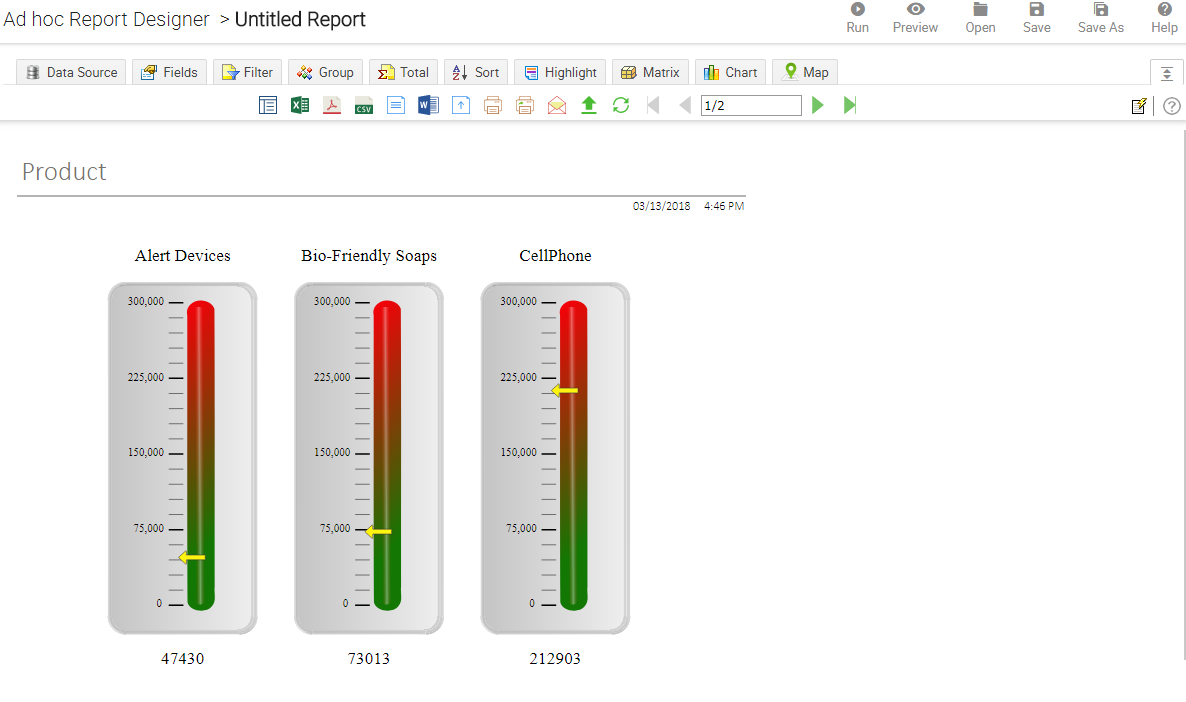
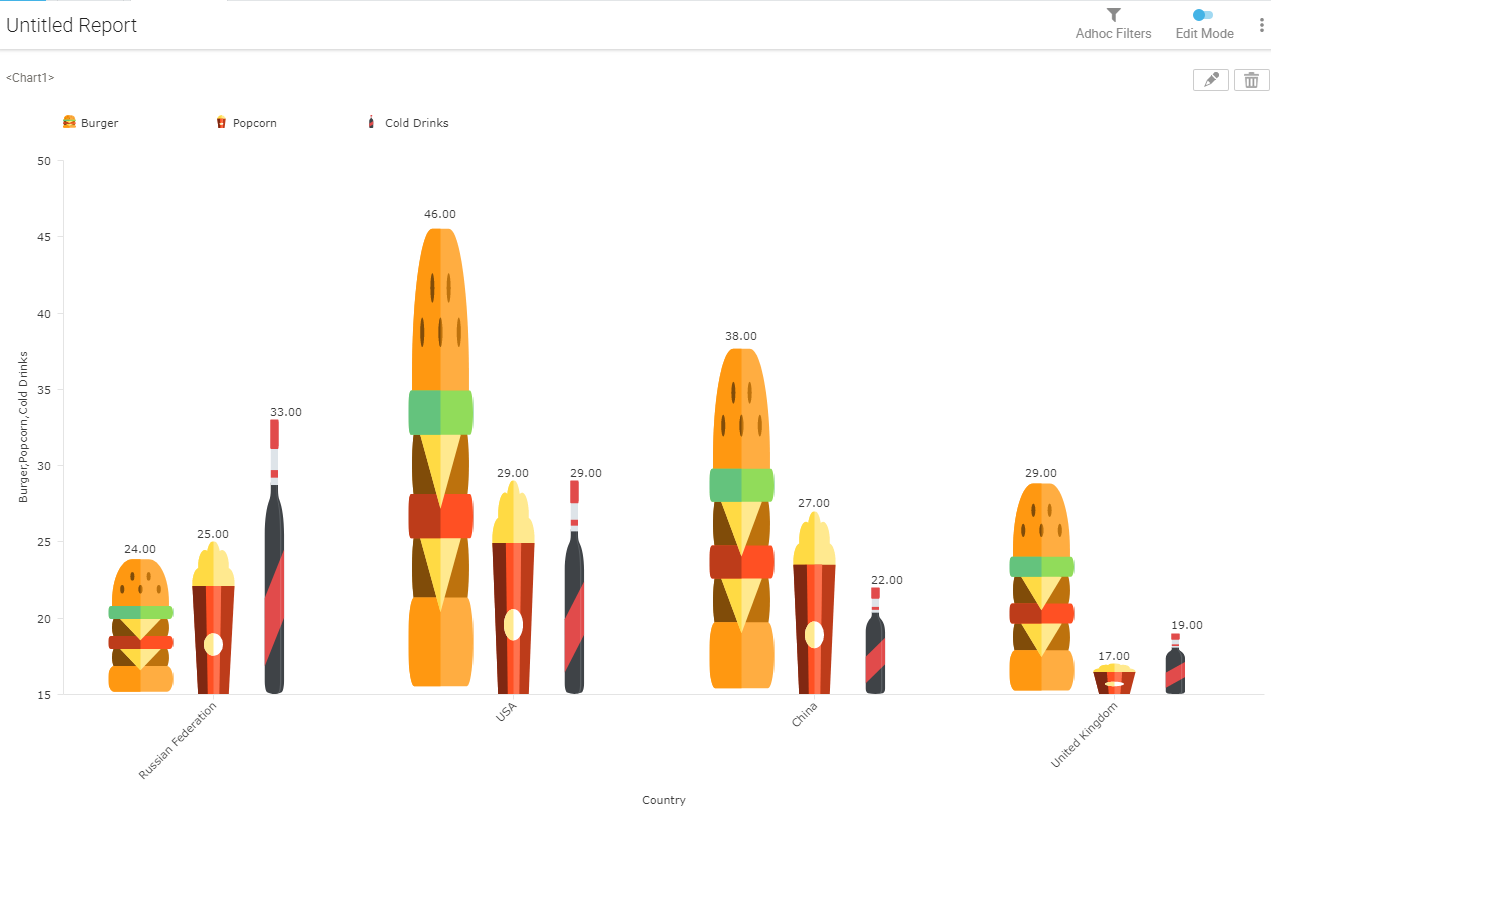
A sample report output using the custom chart type appears as shown in the below image.
The new infographic custom visual for Intellicus charts gives the flexibility to build both simple pictograms and complex highly tailored visuals.
This lets you control the specific appearance of bar, column and bubble charts with precise control of shapes and layout so that you can represent information in a way that best tells the story of your data.
Below is an example telling a story about units of menu items sold by region.
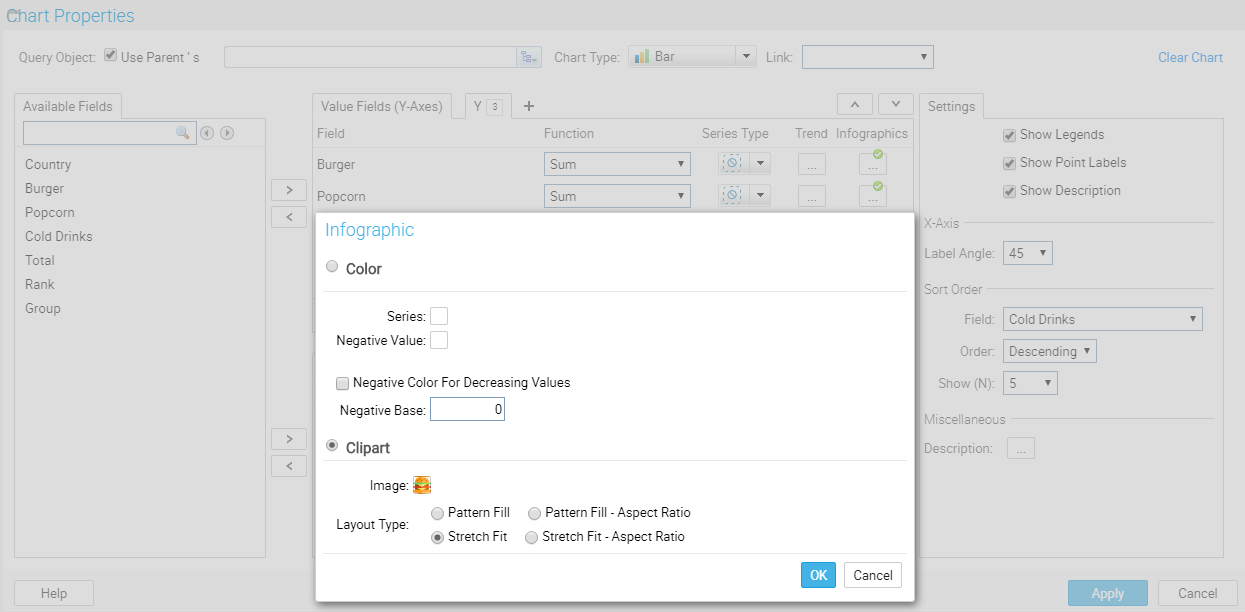
Infographics in Intellicus allows you to customize the chart marks to achieve beautiful, readable, and friendly visualizations.
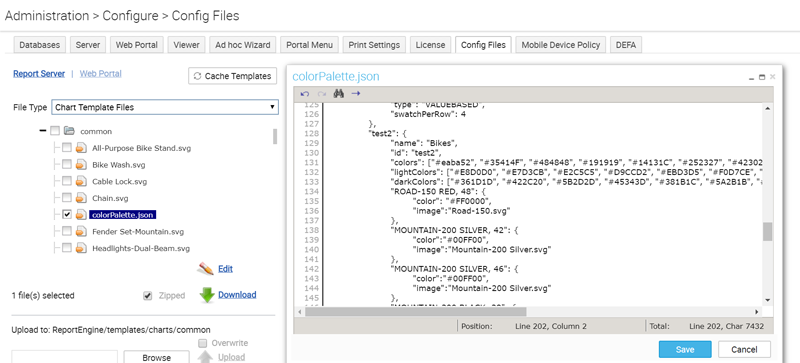
With this feature, you will be able to represent individual data points on a chart to the corresponding color or images. The image and color files will automatically map to the values that have already been specified in colorPalette.json file under
You can also place these files under Administration > Configure > Config files on Intellicus portal.