|
|
|
|
At design time, you can now add descriptions to the charts. The description helps you to add information about the chart which can educate the end user about its context.
An example to how to add description to the chart is shown below:
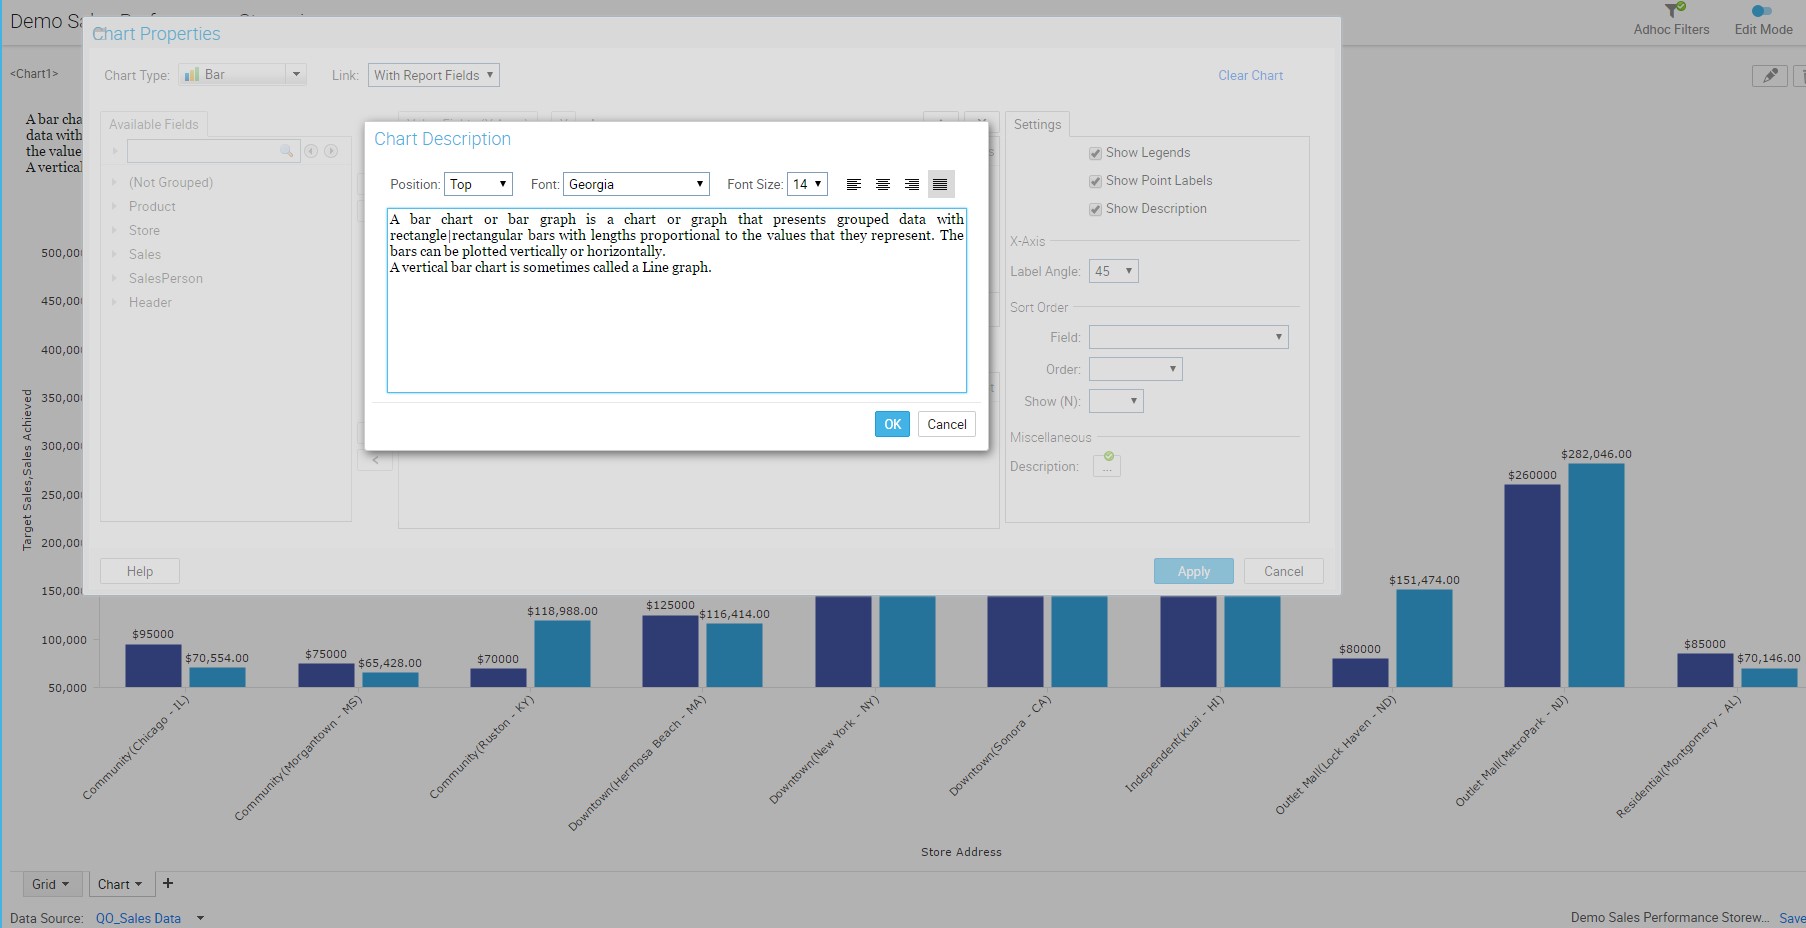
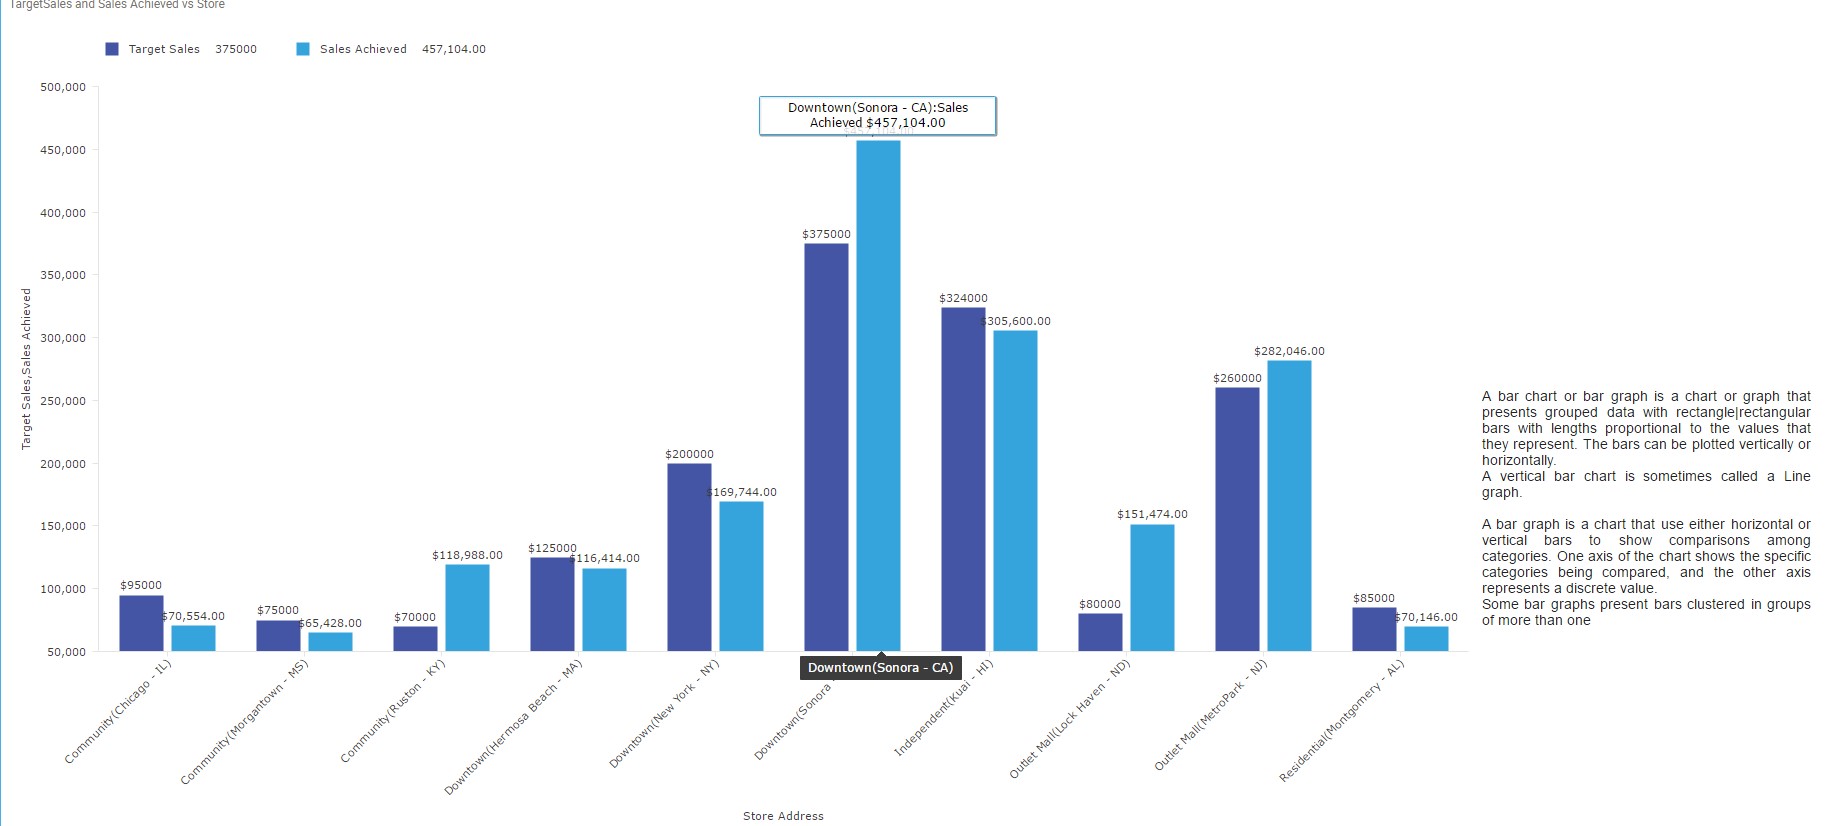
The below screen shows the description as viewed on chart:
Note: Currently chart description is not supported when exporting to MS-Word and PPT formats.
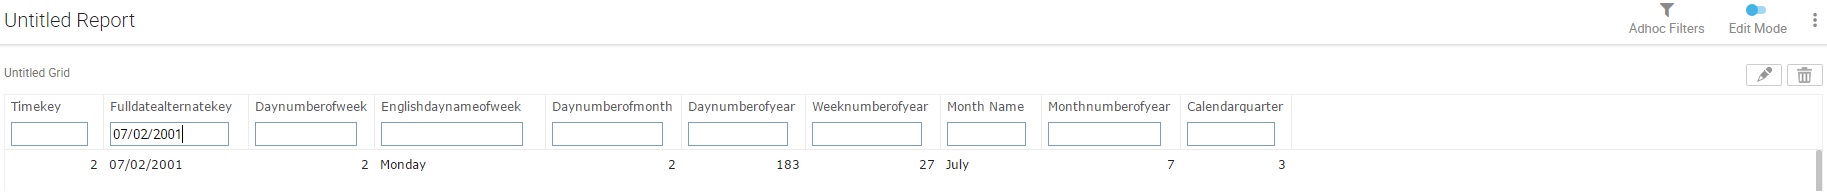
You can type the date in the specified format on the quick filter to filter rows as per the matching condition.
Examples of various filters that can be applied to date fields include: "=07/01/2001" or "07/01/2001", "<07/01/2001", ">07/01/2001", "!=07/01/2001" or "01/01/2001 .. 01/01/2010"
You can customize your ad hoc template to select images that can appear as logo or watermark on the Smart report when exported.
![]()
You can then select the updated template while exporting the report as PDF.
After exporting, the logo/ watermark appears at the specified position of every page of the report.
![]()